Discours de la méthode
stylometric methodology
The Computational Stylistics Group has always had an ambition to understand – on a deeper level – the methodological assumptions behind text-analysis techniques. Consequently, most of the studies conducted by the members of the Group are somewhat methodology-centric. Below we present a selection of the studies that, as we believe, contribute to the state-of-the-art stylometric methodology. Two of these contributions, namely Bootstrap Consensus Networks and Rolling Stylometry, are featured in separate posts.
Sample size in stylometry
The aim of this study (Eder, 2015; cf. pre-print) was to find such a minimal size of text samples for authorship attribution that would provide stable results independent of random noise. A few controlled tests for different sample lengths, languages and genres are discussed and compared.
Although it seems tempting to perform a contrastive analysis of naturally long vs. naturally short texts (e.g. novels vs. short stories, essays vs. blog posts, etc.), to estimate the possible correlation between sample length and attribution accuracy, the results might be biased by inherent cross-genre differences between the two groups of texts. To remedy this limitation, in the present study the same dataset was used for all the comparisons: the goal was to extract shorter and longer virtual samples from the original corpus, using intensive re-sampling in a large number of iterations. The advantage of such a gradual increase of excerpted virtual samples is that it covers a wide range from “very short” to “very long” texts, and further enables capturing a break point of the minimal sample size for a reliable attribution.
The research procedure was as follows. For each text in a given corpus, 500 randomly chosen single words were concatenated into a new sample. These new samples were analyzed using the classical Delta method; the percentage of successful attributions was regarded as a measure of effectiveness of the current sample length. The same steps of excerpting new samples from the original texts, followed by the stage of “guessing” the correct authors, were repeated for the length of 500, 600, 700, 800, …, 20,000 words per sample.
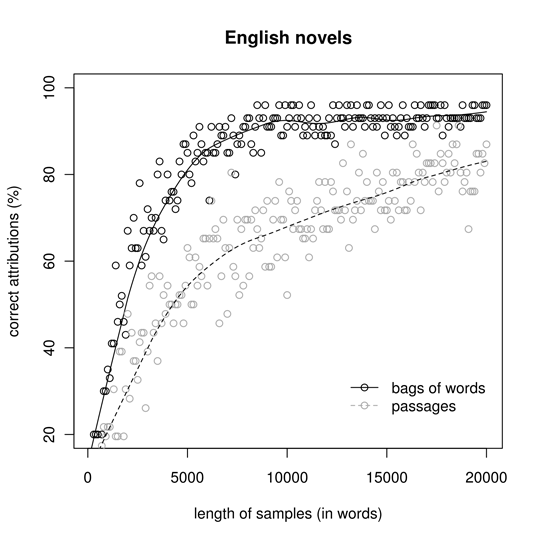
The results for the corpus of 63 English novels are shown in Fig. 1. The observed scores (black circles on the graph; grey circles are discussed in the full-length paper) clearly reveal a trend (solid line): the curve, climbing up very quickly, tends to stabilize at a certain point, which indicates the minimal sample size for the best attribution success rate. Although it is difficult to find the precise position of that point, it becomes quite obvious that samples shorter than 5,000 words provide a poor “guess”, because they can be immensely affected by random noise. Below the size of 3,000 words, the obtained results are simply disastrous (more than 60% of false attributions for 1,000-word samples may serve as a convincing caveat). Other analyzed corpora showed quite similar shapes of the “learning curves”.
The above findings, however, have been (partially) falsified in a subsequent study (Eder, 2017; see here). It turns out that the minimal sample size varies considerably between different authors and different texts: sometimes as little as 1,500 words is enough to see the signal, and in other cases 20,000 words is still too little. A full-length paper is pending.
Do we need the most frequent words?
The aim of this study (Rybicki and Eder, 2011; cf. pre-print) was to examine the strength of the authorial signal in correlation with different vectors of frequent words. Contrary to usual approaches that investigate the performance of the very top of the list of the most frequent words, hundreds of possible combinations of word vectors were tested in this study, not solely starting with the most frequent word in each corpus.
Each analysis was first made with the top 50 most frequent words in the corpus; then the 50 most frequent words would be omitted and the next 50 words (i.e. words ranked 51 to 100 in the descending word frequency list) would be taken for analysis; then the next 50 most frequent words (those ranked 101 to 150), and so on until the required limit (usually the 5,000th most frequent words) would be reached. Then the procedure would restart with the first 100 words (1-100), the second 100 words (101-100), and so on. At every subsequent restart, the number of the words omitted from the top of the frequency list would be increased by 50 until the length of this “moving window” descending down the word frequency list reached another limit (usually 5,000).
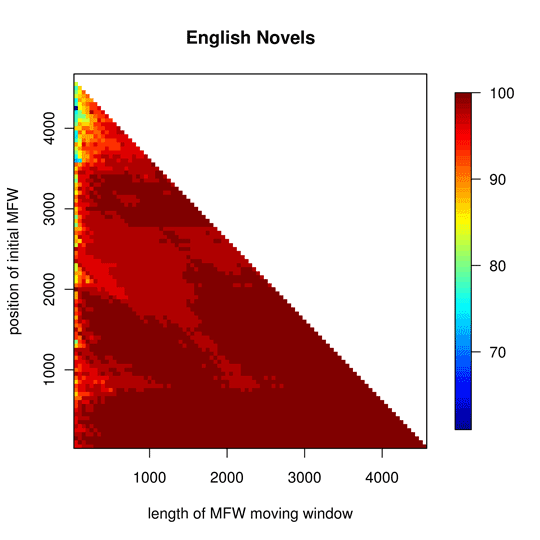
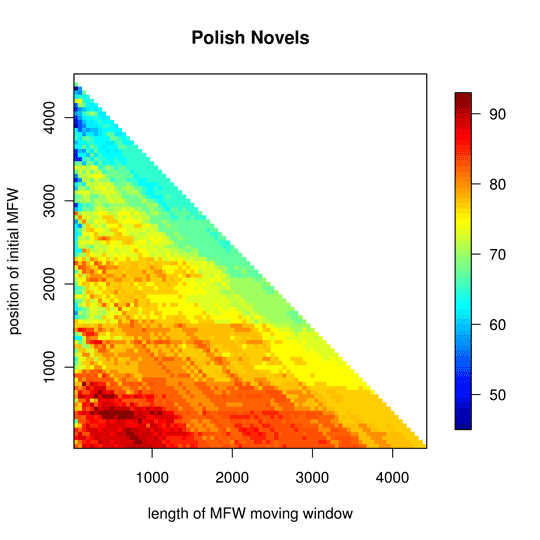
The English novel corpus (Fig. 2, left) was the one with the best attributions for all available vector sizes starting at the top of the reference corpus word frequency list; it was equally easy to attribute even if the first 2,000 most frequent words were omitted in the analysis – or, for longer vectors, even the first 3,000. This was also the only corpus where a perfect attributive score (100%) was achieved almost always, which is reflected, in the graph, by the widespread and smooth dark colour in the heatmap.
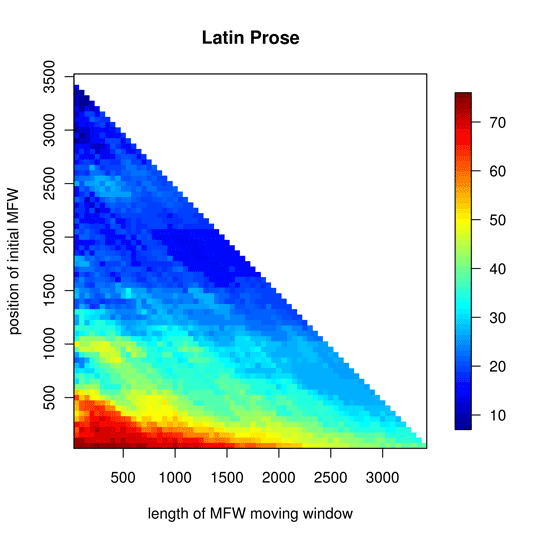
For instance, the corpus of Latin prose texts (Fig. 2, right) could serve as excellent evidence for a minimalist approach in authorship attribution based on most frequent words, as the best (if not perfect) results were obtained by staying close to the axis intersection point: no more than 750 words, taken no further than from the 50th place on the frequency rank list. The top score, 75%, was in fact achieved only once – at 250 MFWs from the top of the list. Other corpora tested in this study are discussed in detail in the above-mentioned paper.
Fake authorships
This study (Ochab, 2017; cf. pre-print) was conducted to test to which extent the authorial signal is hidden in the lexical layer (i.e. the choice of words), and to which extent it is determined by grammatical structures. It is a part of the general effort to disentangle the influence of various text characteristics (e.g. style, genre, age, topic) on the results of authorship attribution algorithms (AAA).
The classic algorithms rely on measuring pairwise similarities between texts in the corpus and these similarities, in turn, are often computed based on word occurrence frequencies. The word frequencies do not only reflect direct lexical selection (be it conscious or unconscious) by an author, but are also indirectly governed or affected by his or her grammar choices, including some simple quantifiable characteristics such as: clause types, clause lengths, distribution of parts of speech (POS) and groups thereof.
Here, the grammar choices were quantified in a simplified manner as frequencies of POS tags, whereas the lexical choices were quantified as frequencies of words within each POS category. Consequently, two differing word frequency distributions – as a proxy of two authorial styles – arise from differing distributions of POS-tags AND distributions of words labelled with a given POS tag. However, an AAA measuring text similarity, e.g., by means of Burrows’s delta distance does not differentiate between these two and provides a joint score.
Does that mean we can change a classification result of such an algorithm modifying grammar only? Phrased differently: can we imitate the style of an author while still using our own words?
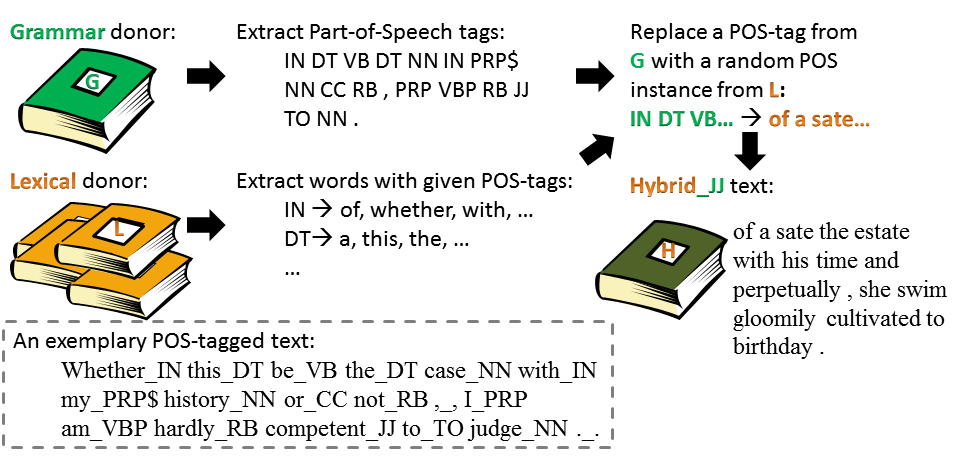
To answer that question we generated a hybrid text with vocabulary of one author and grammar of another, as shown in Fig. 3. In this case, we took POS-tags from A. Brontë’s Agnes Grey and the words from three works by W. M. Thackeray. Then we replaced each POS-tag with a random word belonging to that POS category, obtaining a hybrid book of the same length and POS structure as Agnes Grey. Thus, even though the words of the book are Thackeray’s, their frequencies are constrained by the grammatical structures provided by Brontë.
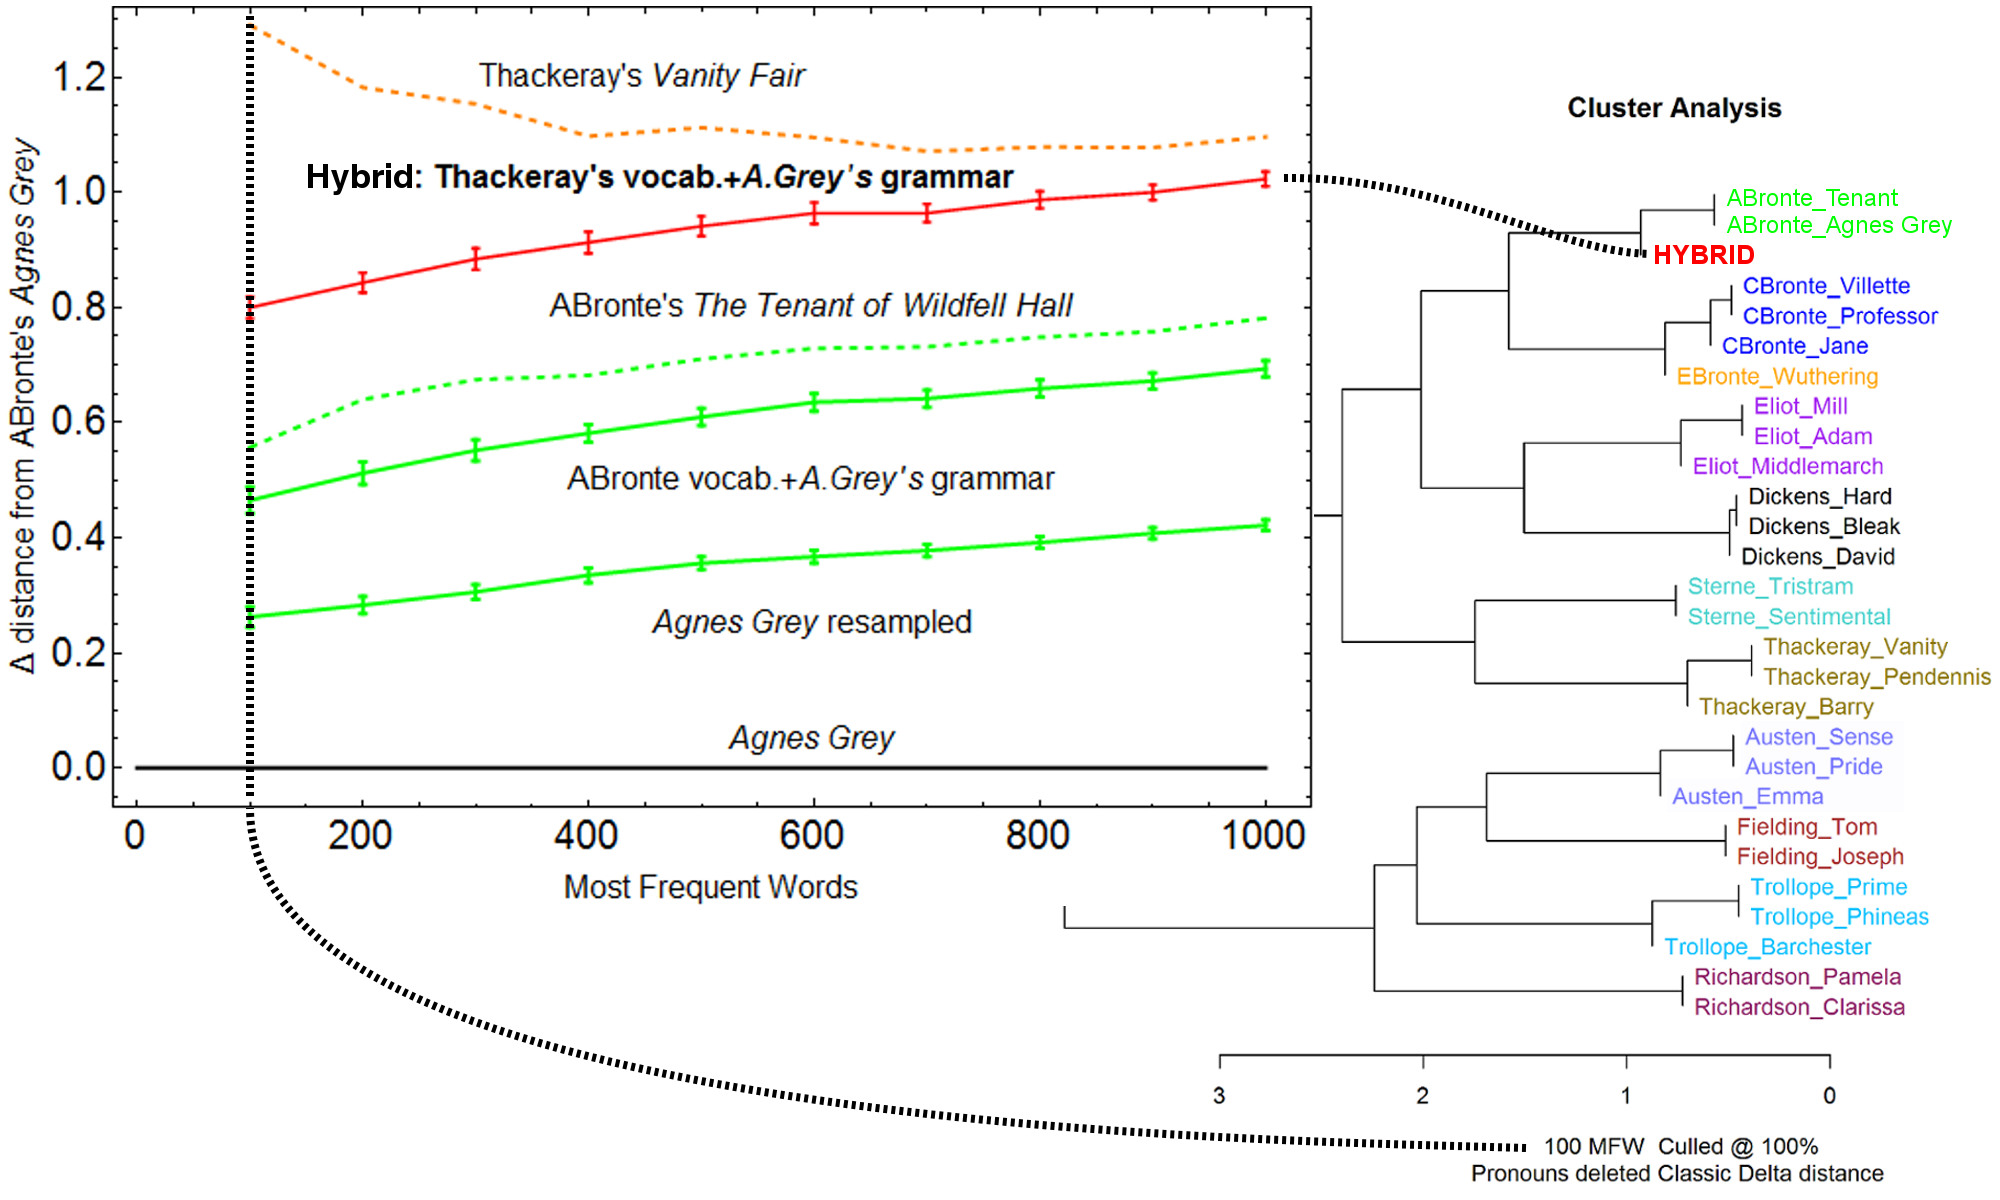
Fig. 4 illustrates the delta distance (as a function of the number of most frequent words) between the original Agnes Grey and from bottom up: (i) a generated text of the same length and the words sampled from the book, (ii) a generated text of the same length and the words sampled from two books by A. Brontë, (iii) The Tenant of Wildfell Hall, (iv) the hybrid text generated as described above, (v) Vanity Fair. The graph shows that especially for a low number of MFW the hybrid is significantly closer to the original book by Brontë than a novel by Thackeray. The grammar wins and the hybrid joins A. Brontë’s cluster. For a large number of MFW, the vocabulary wins and the hybrid joins Thackeray’s cluster.
In this study, the corpus comprised 27 classic English novels published between 1740-1876 by 11 authors, one to three books each. We used Stanford POS tagger.
How to choose training samples?
The next study (Eder and Rybicki, 2013; cf. pre-print) investigates the problem of appropriate choice of texts for the training set in machine-learning classification techniques. Intuition suggests composing a training set from the most typical texts (whatever “typical” means) by the authors studied (thus, for Goethe, Werther rather than Farbenlehre; for Dickens, Great Expectations rather than A Tale of Two Cities; for Sienkiewicz, his historical romances rather than his Letters from America). Certainly, the world of machine-learning knows the idea of k-fold cross-validation, or composing the training test iteratively (and randomly) in k turns. However, no matter how useful this technique is, the question remains: to what extent non-typical works might bias the results of an authorship attribution experiment?
The idea applied in this study was quite simple: a controlled experiment of 500 iterations of attributive tests was performed, each with random selection of the training and test sets. The selections were made so that each author was always represented in the training set by a single (randomly-chosen) text, and that the test set always contained the same number of texts by each author. This was done to prevent a situation in which no works at all by one or more of the test authors would be found in the training set. Then the number of correct author guesses were compared, in the context of the hypothesis that the more resistant a corpus is to changes in the choice of the two sets, the more stable the results. The peak of the distribution curve would indicate the real effectiveness of the method, while its tails – the impact of random factors. A thin and tall peak would thus imply stable results resistant to changes in the training set.
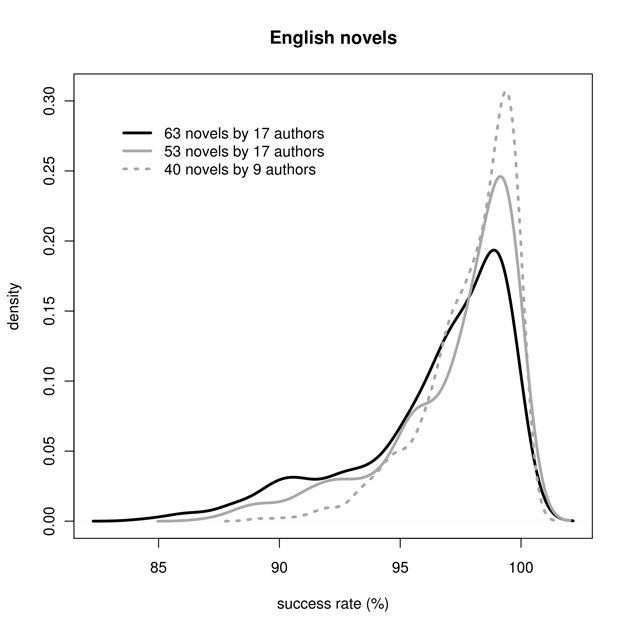
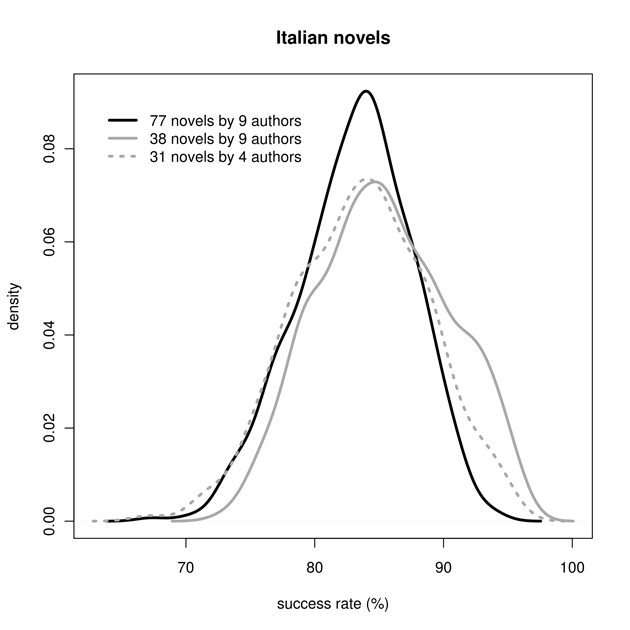
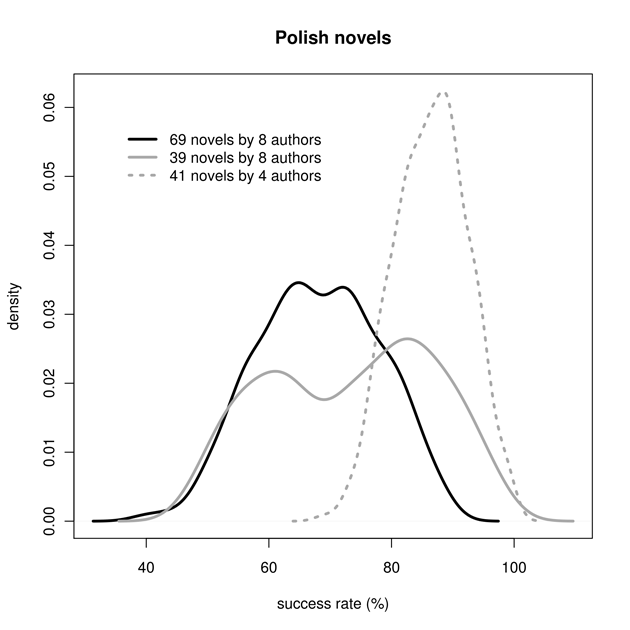
As expected, the density of the 500 iterations for the corpus of 63 English novels follows a (skewed) bell curve (Fig. 5, left). At the same time, its gentler left slope suggests that, depending on the choice of the training set, the percentage of correct attributions can vary, and, with bad luck, go below 90%. The Italian corpus is a quintessenza of consistency but, at this time, the most frequent accuracy rate has receded to below 85%, i.e. into regions rarely visited even by the worst combinations of training- and test-set texts in the English or even the French corpus. By contrast, the results for the Polish corpus are a true katastrofa: any attempt at broadening the corpus brings both accuracy and consistency below any standards acceptable. Other corpora tested in this study are discussed in detail in the above-mentioned paper.
Bootstrapped Delta
The following study (Eder, 2013b; cf. pre-print) investigates the so-called “open-set” attribution problem: when an investigated anonymous text might have been written by any contemporary writer, and the attributor has no prior knowledge whether a sample written by a possible candidate is included in the reference corpus. A vast majority of methods used in stylometry establish a classification of samples and strive to find the nearest neighbors among them. Unfortunately, these techniques of classification are not resistant to a common mis-classification error: any two nearest samples are claimed to be similar, no matter how distant they are.
The method presented here relies on the author’s empirical observation that the distance between samples similar to each other is quite stable despite different vectors of most frequent words tested, while the distance between heterogeneous samples often displays some unsteadiness depending on the number of MFWs analyzed. The core of the procedure is to perform a series of attribution tests in, say, 1,000 iterations, where the number of MFWs to be analyzed is chosen randomly (e.g., 334, 638, 72, 201, 904, 145, 134, 762, …); in each iteration, the nearest neighbor classification is performed. Next, the tables are arranged in a large three-dimensional table-of-tables.
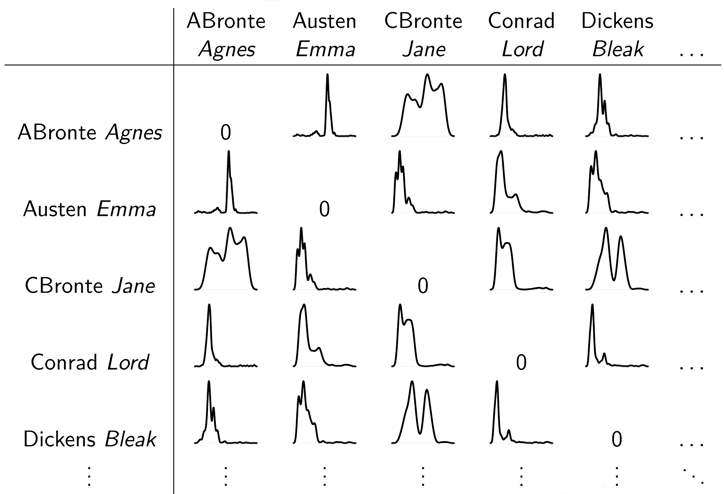
The next stage is to estimate the distribution for each cell across 1,000 layers of the composite table. This is a crucial point of the whole procedure. While classical nearest neighbor classifications rely on point estimation (i.e. the distance between two samples is always represented by a single numeric value), the new technique introduces the concept of distribution estimation, as shown in Fig. 6. Using some properties of these distributions, one can establish confidence intervals. Namely, the distance between two samples is a range of values represented by the mean of 1,000 bootstrap trials plus 1.64σij below and 1.64σij above the arithmetic mean of the distribution.
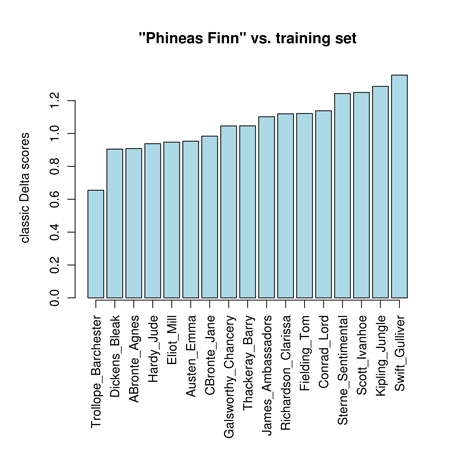
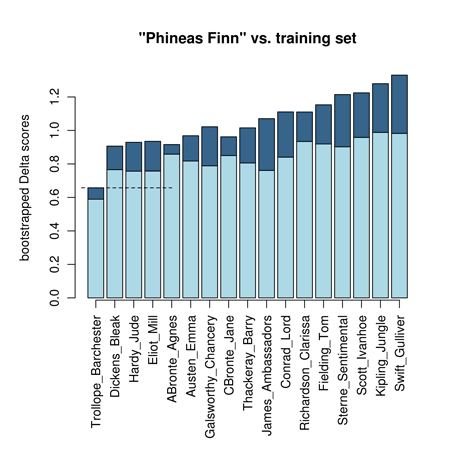
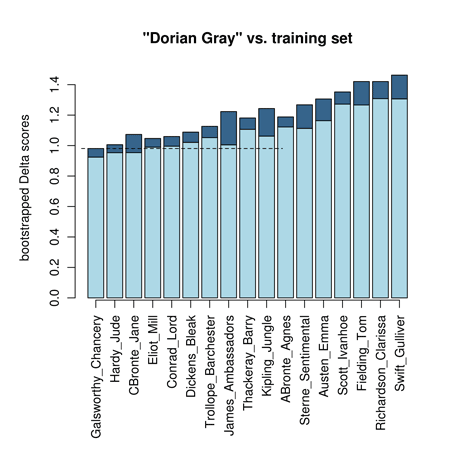
An exemplary ranking of candidates is shown in Fig. 7. The most likely author of Phineas Finn is Trollope (as expected), and the calculated confidence interval does not overlap with any other range of uncertainty. The real strength of the method, however, is evidenced in the case of The Portrait of Dorian Gray, where the training set does not contain (intentionally) samples of Wilde. Classic Delta simply ranks the candidates, Hardy being the first, while in the new technique, confidence intervals of the first three candidates partially overlap with one another. Consequently, the assumed probability of authorship of Dorian Gray is shared between Galsworthy (54.2%), Hardy (34.8%) and Charlotte Brontë (11%). The ambiguous probabilities strongly indicate fake candidates in an open-set attribution case.
Systematic errors in stylometry
This study (Eder, 2013a; cf. pre-print) attempts to verify the impact of unwanted noise – e.g. caused by an untidily-prepared corpus – in a series of experiments conducted on several corpora of English, German, Polish, Ancient Greek and Latin prose texts. Since it is rather naive to believe that noise can be entirely neutralized, the actual question at stake is: what degree of nonchalance is acceptable to obtain sufficiently reliable results?
The nature of noise affecting stylometric results is quite complex. On the one hand, a machine-readable text might be contaminated by poor OCR, mismatched codepages, improperly removed XML tags; by including non-authorial textual additions, such as prefaces, footnotes, commentaries, disclaimers, etc. On the other hand, there are some types of unwanted noise that can by no means be referred to as systematic errors; they include scribal textual variants (variae lectiones), omissions (lacunae), interpolations, hidden plagiarism, editorial decisions for uniform spelling, modernizing the punctuation, and so on. Both types of noise, however, share a very characteristic feature. Namely, the longer the distance between the time when a given text was written and the moment of its digitization, the more opportunities of potential error to occur, for different reasons.
The first experiment was designed to simulate the impact of poor OCR. In 100 iterations, a given corpus was gradually damaged, and controlled tests for authorship were applied. In each of the 100 iterations, an increasing percentage of randomly chosen letters (excluding spaces) were replaced with other randomly chosen letters. E.g. in the 20th iteration, every letter of the input text was intended to be damaged with a probability of 20%; consequently, the corpus contained roughly 20% of independently damaged letters: “Mrs Lonr saas khat tetherfiild is taksn by a ysung man of lsrce footune” etc.
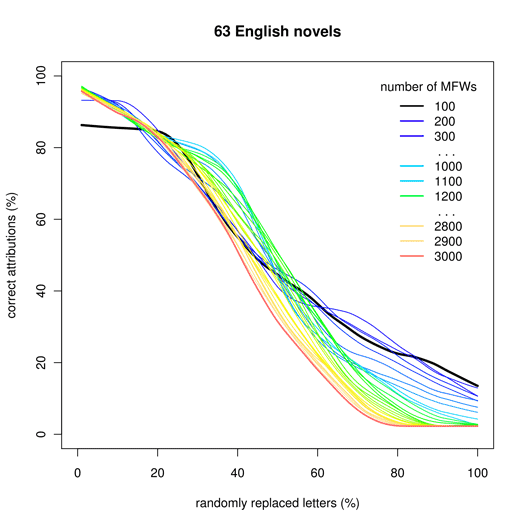
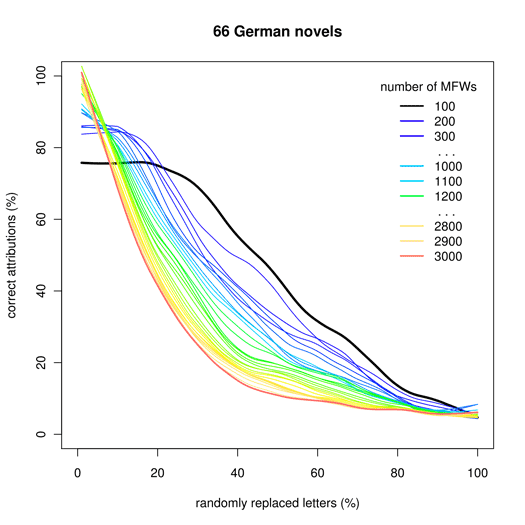
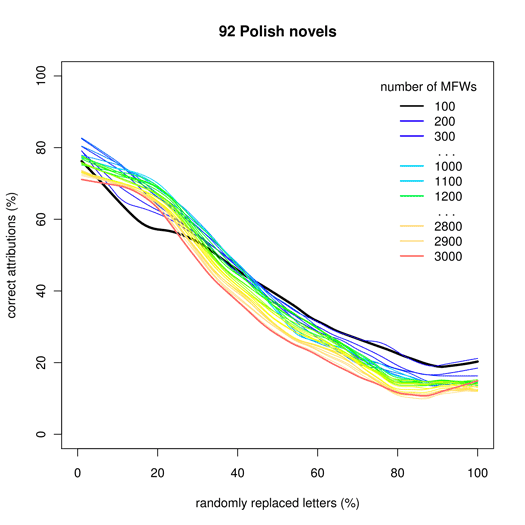
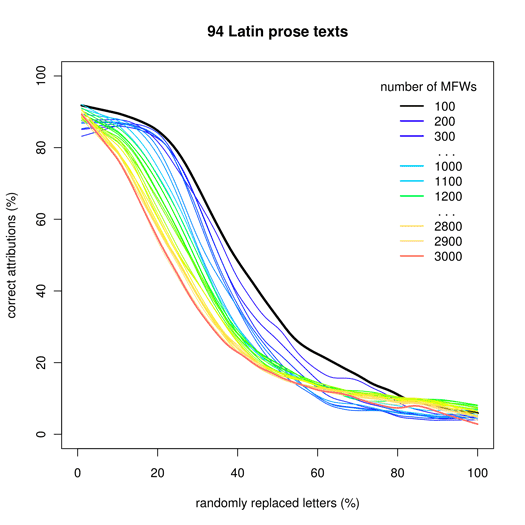
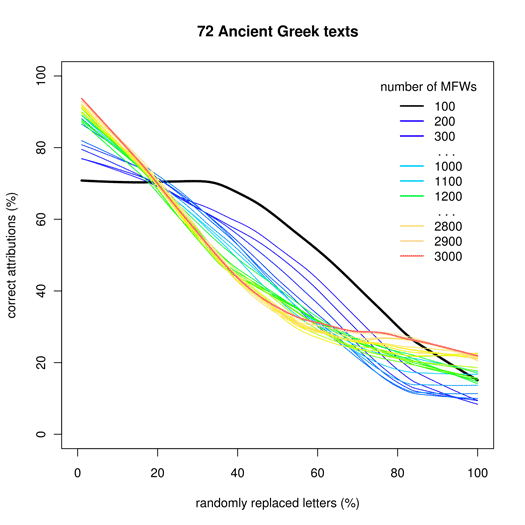
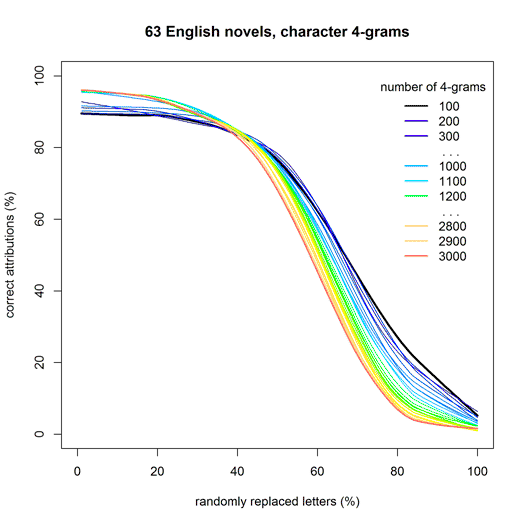
The results were quite similar for most of the corpora tested. As shown in Fig. 8, short vectors of MFWs (up to 500 words) usually provide no significant decrease of performance despite a considerably large amount of noise added (the corpus of Polish novels being an exception). Even 20% of damaged letters would not affect the results in some cases! However, longer MFW vectors are very sensitive to misspelled characters: any additional noise means a steep decrease of performance. This means that the “garbage in, gospel out” optimism is in fact illusory.
Character-based markers, however, revealed an impressive increase of performance, regardless of the classification method used. As evidenced in Fig. 8 (bottom-right, for character 4-grams), the threshold where the noise finally starts to overwhelm the attributive scores is settled somewhere around the point of 40% distorted characters. It is hard to believe how robust this type of style-marker is when confronted with a dirty corpus – to kill the authorial signal efficiently, one needs to distort more than 60% of original characters (!).
A detailed comparison of different corpora, classifiers and feature types, as well as an alternative experiment aimed at measuring the impact of intertextuality, is provided by the above-mentioned full-length paper.
References
Eder, M. (2013a). Mind your corpus: systematic errors in authorship attribution. Literary and Linguistic Computing, 28(4): 603-14, [pre-print].
Eder, M. (2013b). Bootstrapping Delta: a safety-net in open-set authorship attribution. Digital Humanities 2013: Conference Abstracts. Lincoln: University of Nebraska-Lincoln, pp. 169-72, http://dh2013.unl.edu/abstracts/index.html, [pre-print].
Eder, M. (2015). Does size matter? Authorship attribution, small samples, big problem. Digital Scholarship in the Humanities, 30(2): 167-182, [pre-print].
Eder, M. (2017). Short samples in authorship attribution: A new approach. Digital Humanities 2017: Conference Abstracts. Montreal: McGill University, pp. 221–24, https://dh2017.adho.org/abstracts/341/341.pdf.
Eder, M. and Rybicki, J. (2013). Do birds of a feather really flock together, or how to choose training samples for authorship attribution. Literary and Linguistic Computing, 28(2): 229-36, [pre-print].
Ochab, J. K. (2017). Stylometric networks and fake authorships. Leonardo, 50(5): 502, doi:10.1162/LEON_a_01279, [pre-print].
Rybicki, J. and Eder, M. (2011). Deeper Delta across genres and languages: do we really need the most frequent words? Literary and Linguistic Computing, 26(3): 315-21, [pre-print].