Testing rolling stylometry
The following sections briefly introduce a new stylometric method (Eder, 2015) that combines supervised machine-learning classification with the idea of sequential analysis. Unlike standard procedures, aimed at assessing style differentiation between discrete text samples, the new method, supported with compact visualization, tries to look inside a text represented as a set of linearly sliced chunks, in order to test their stylistic consistency. Three flavors of the method have been introduced: (i) Rolling SVM, relying on the support vector machines classifier, (ii) Rolling NSC, based on the nearest shrunken centroids method, and (iii) Rolling Delta, using the classic Burrowsian measure of similarity. The technique is primarily intended to assess mixed authorship; however, it can be also used as a magnifying glass to inspect works with unclear stylometric signal. To test its applicability, three different examples of collaborative work have been examined: (i) the 13th-century French allegorical poem “Roman de la Rose”, (ii) a 15th-century translation of the Bible into Polish known as “Queen Sophia’s Bible”, and (iii) “The Inheritors”, a novel collaboratively written by Joseph Conrad and Ford Madox Ford in 1901.
Supposing there is a work written collaboratively – i.e. a text in which some authorial takeovers are suspected to have happened – the procedure starts with chunking the text into consecutive samples, or equal-size blocks of N words (tokens). Arguably, any classification method can be rolled through these blocks, in the present study, however, three supervised classification techniques known for their high accuracy were used: SVM, NSC, and Delta. Even if they rely on substantially different mathematical kernels, SVM, NSC and Delta use exactly the same corpus setup to carry out the classification. Namely, a number of representative samples for each class is expected to constitute a reference set (training set), while the remaining samples, including anonymous ones, go to a test set. Next, each sample from the test set is checked against the training set in order to identify the most similar authorial profile (i.e. the best matched training class). In rolling stylometry, roughly the same setup is used. The only difference is that instead of several samples, the test set contains a single work to be chunked automatically into equal-sized segments.
The final stage of the analysis involves a graphical representation of stylistic changes throughout a chunked text. A simple home-brew graph has been used. To keep the plot clean, any redundant information have been removed. The goal was to emphasize visually the most likely candidate – i.e. the actual answer of the classifier – and to keep less probable candidates slightly in the shadow. To this end, horizontal stripes colored according to the assigned class were used, the primary stripe bold.


Further reading
The above procedure is described in detail in the following paper: Eder, M. (2016). Rolling stylometry. Digital Scholarship in the Humanities, 31(3): 457-469, [pre-print].
The code
The rolling stylometry technique is supported by the R package stylo
(ver. >=0.5.8), through the function rolling.classify(). However,
since the function is not supplemented by GUI yet, it might look
non-intuitive. This appendix provides a concise step-by-step howto
explaining its usage. To reproduce the plots as shown above, follow
these steps:
-
Install the package stylo in the version >= 0.5.8. Click here for further details.
-
Create a new folder: it will serve as a working space for your experiment. Create two subfolders named
test_setandreference_set(all file names are case sensitive!). Put your disputed text into thetest_set, put the remaining texts into thereference_set. The setup for the Conrad/Ford case was as follows:
reference_set
    Conrad_Chance_1913.txt
    Conrad_Heart_1899.txt
    Conrad_Lord_1900.txt
    Conrad_Nigger_1897.txt
    Conrad_Victory_1915.txt
    Conrad_Western_1911.txt
    Ford_Apollo_1908.txt
    Ford_Benefactor_1905.txt
    Ford_Girl_1907.txt
    Ford_Nancy_1911.txt
    Ford_Seal_1907.txt
    Ford_Soldier_1915.txt

test_set
    Conford_Inheritors_1901.txt
The complete setup for the Roman de la Rose case can be downloaded from here.
- Load the library
stylo, set your working directory:
library(stylo)
setwd("path/to/the/folder/containing/two/subcorpora")
- Optional but important: read the help page for the function
rolling.classify():
help(rolling.classify)
- Run the function
rolling.classify(), use as many arguments as needed:
# Fig. 1
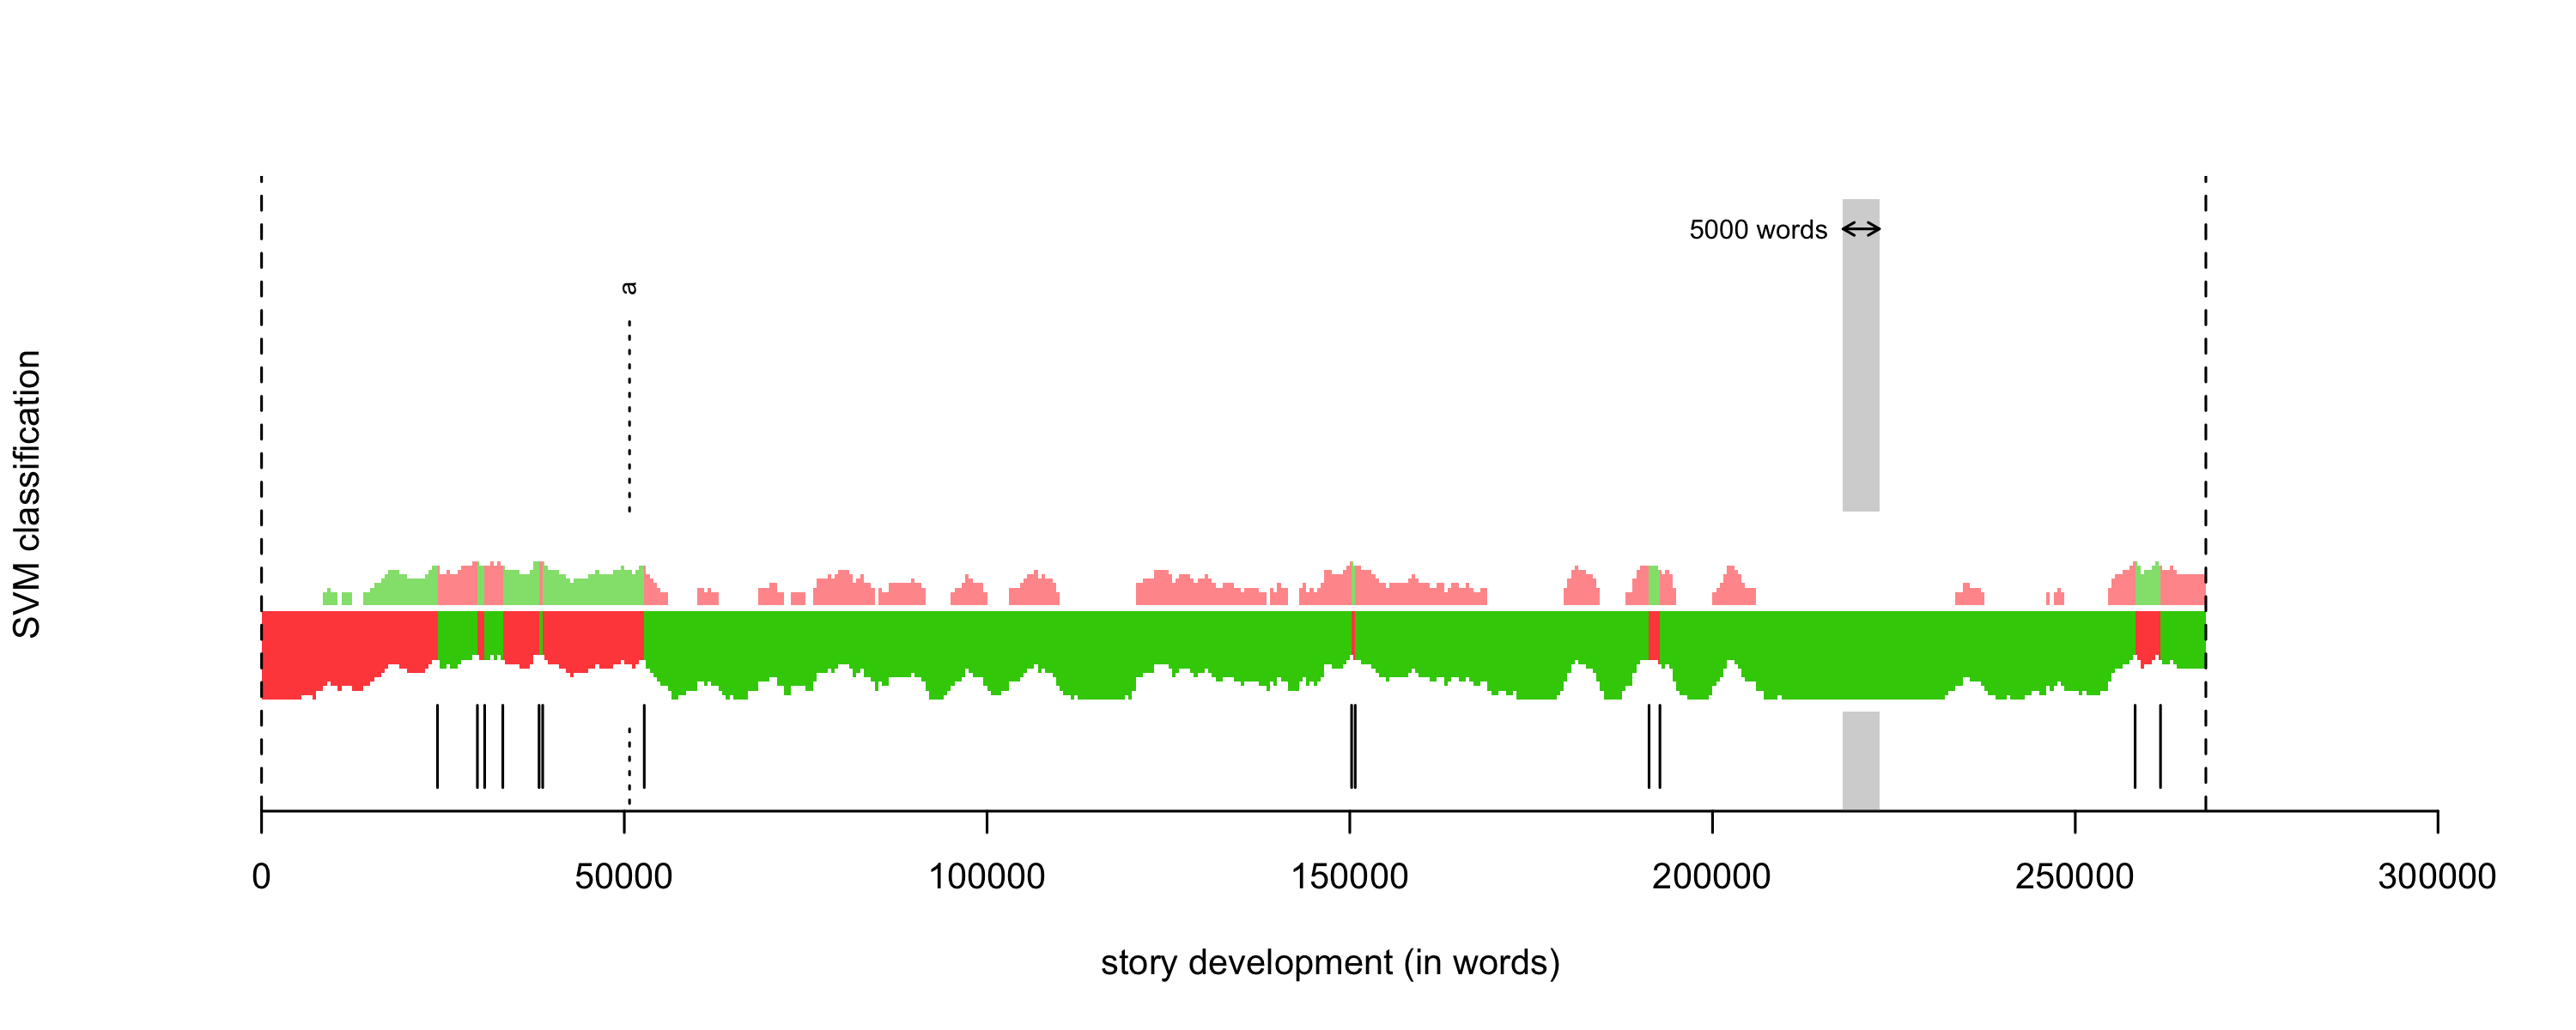
rolling.classify(write.png.file = TRUE, classification.method = "svm", mfw=100, training.set.sampling = "normal.sampling", slice.size = 5000, slice.overlap = 4500)
The vertical dashed line that divides the part by Guillaume de Lorris and Jean de Meun is produced by adding the word “xmilestone” into the input text, after the line 4,058. One can add as many milestones as needed; they will be reproduced in the final plot and labelled automatically using lowercase roman letters.
# Fig. 2
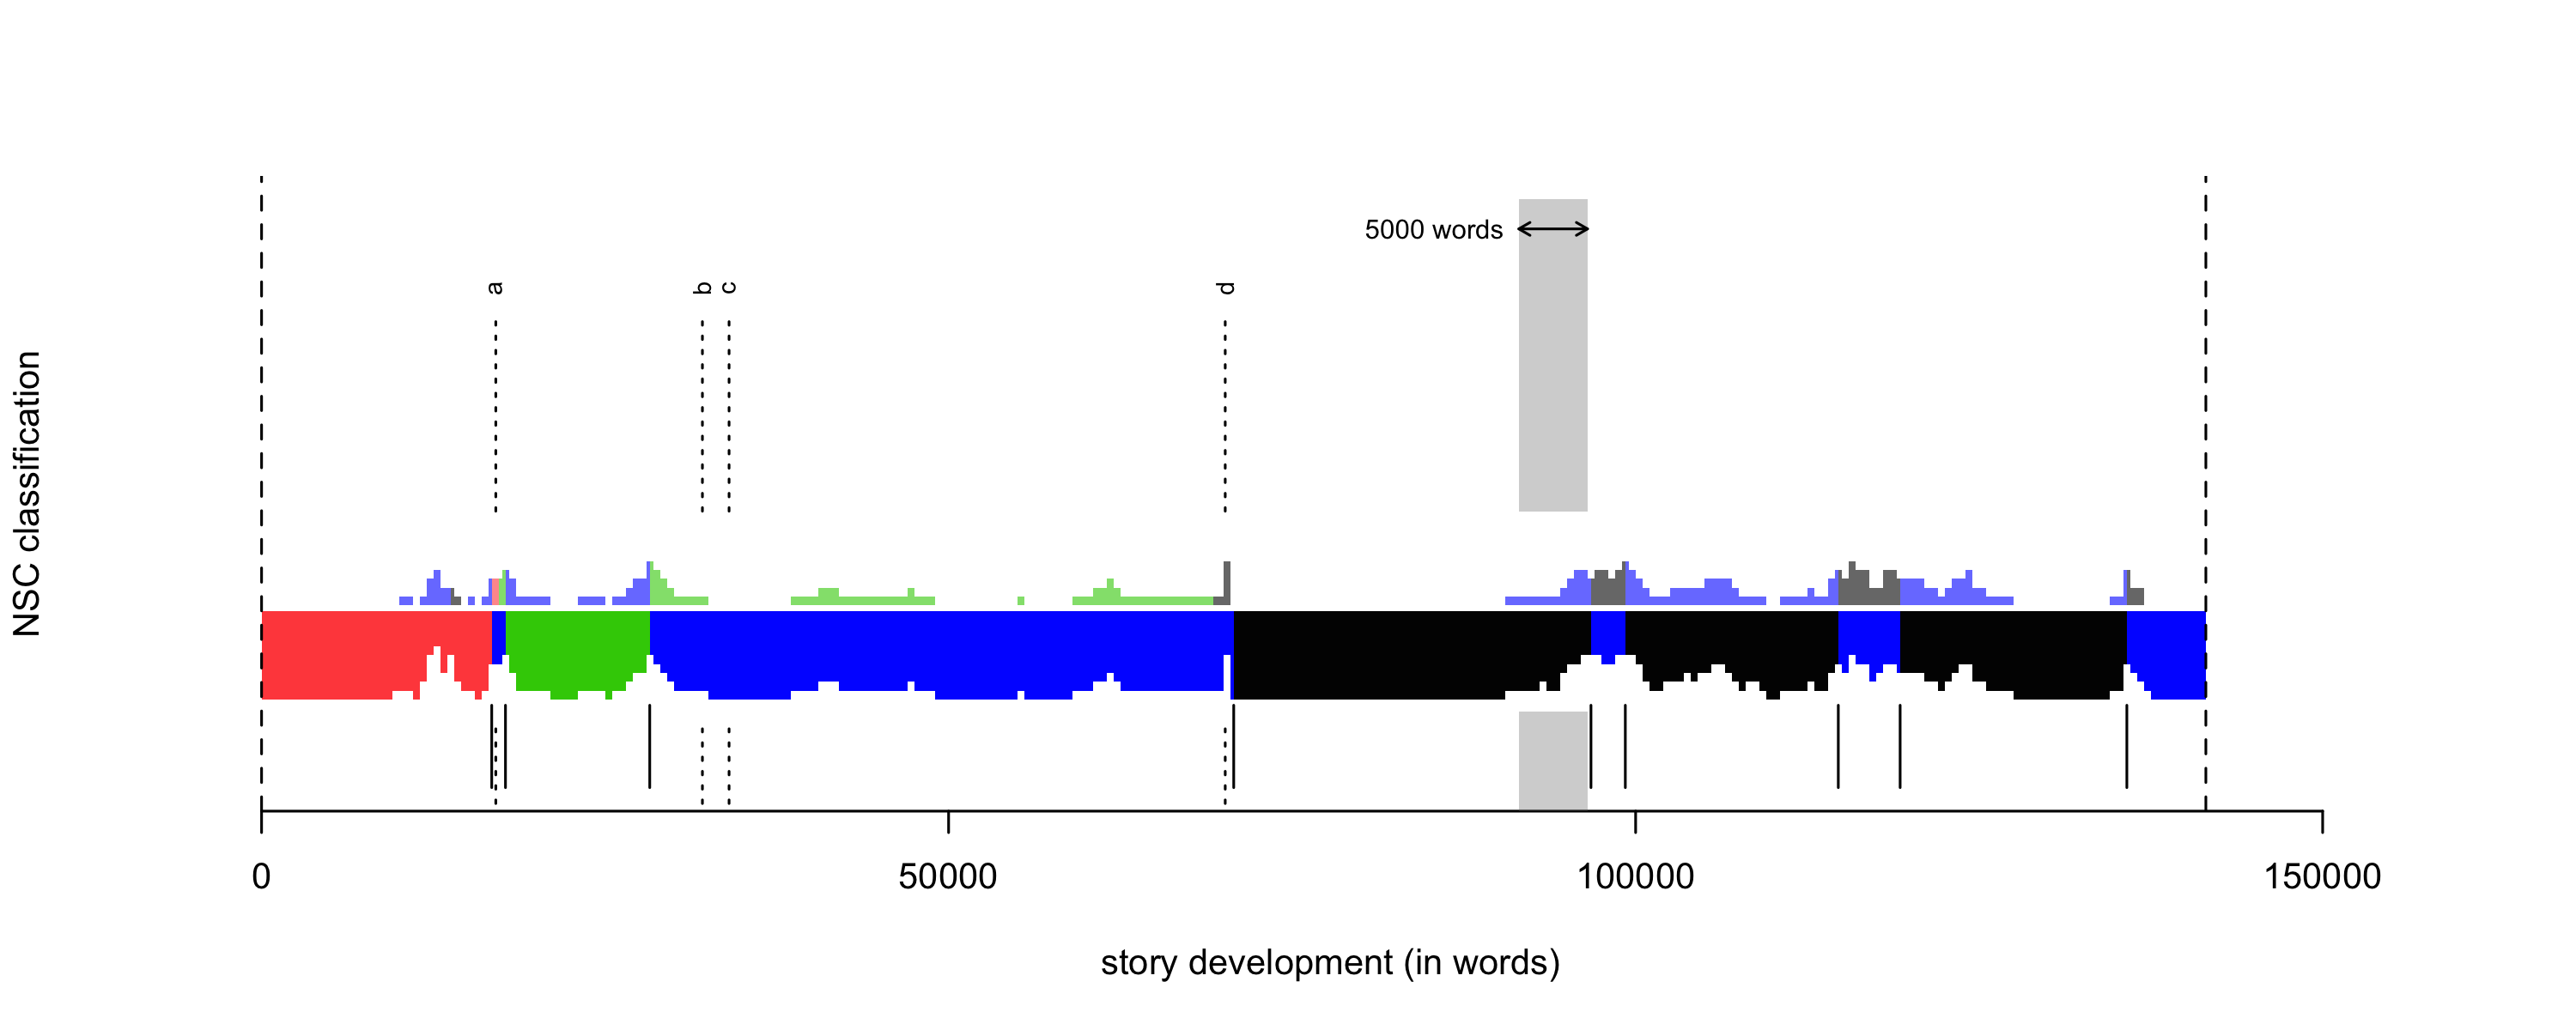
rolling.classify(write.png.file = TRUE, classification.method = "nsc", mfw=50, training.set.sampling = "normal.sampling", slice.size = 5000, slice.overlap = 4500)

# Fig. 3
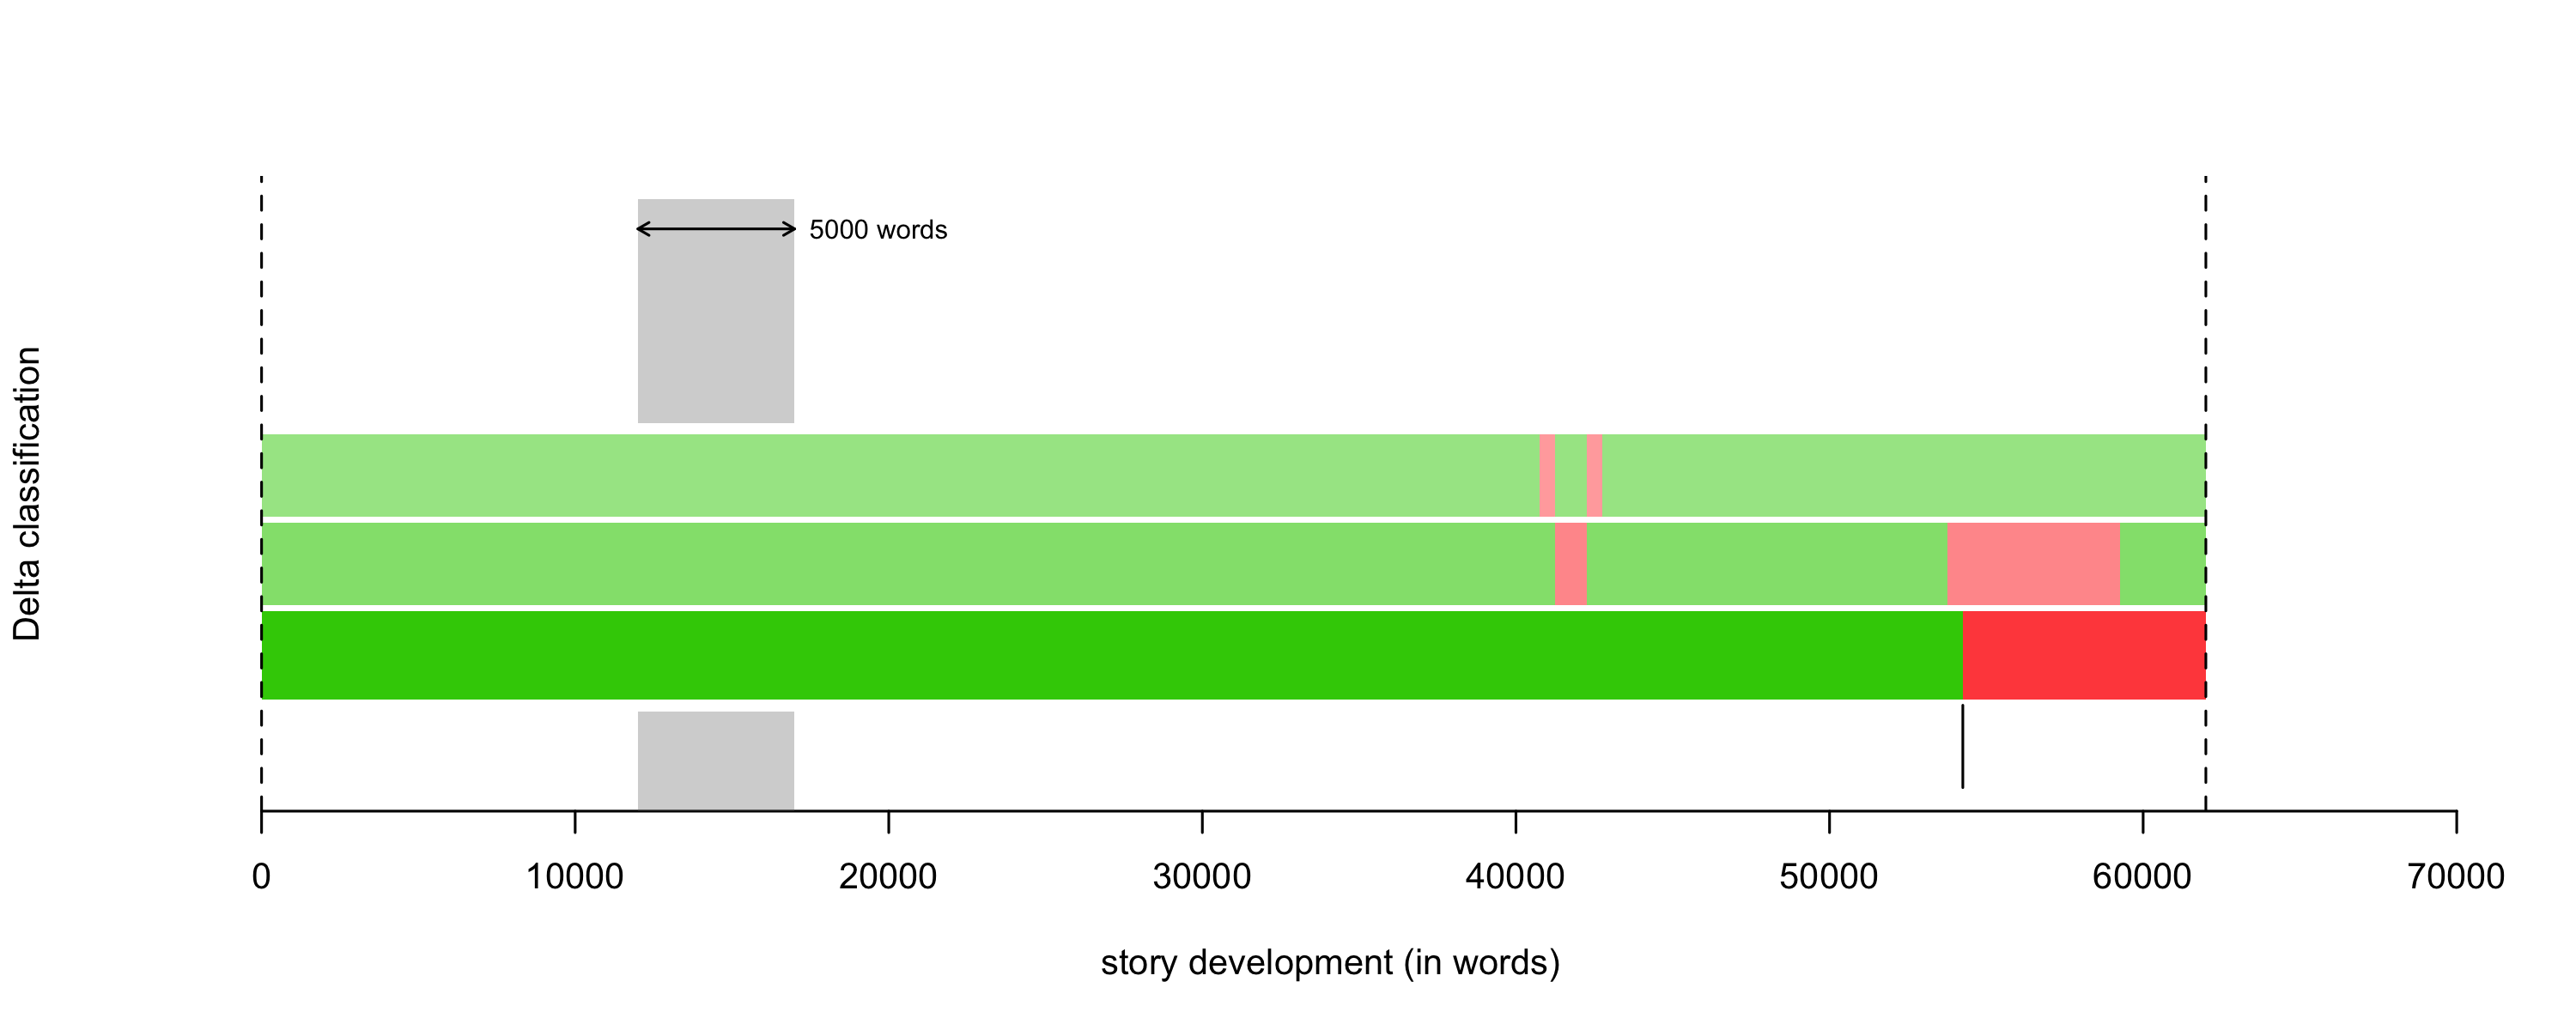
rolling.classify(write.png.file = TRUE, classification.method = "delta", mfw=1000)

# Fig. 4
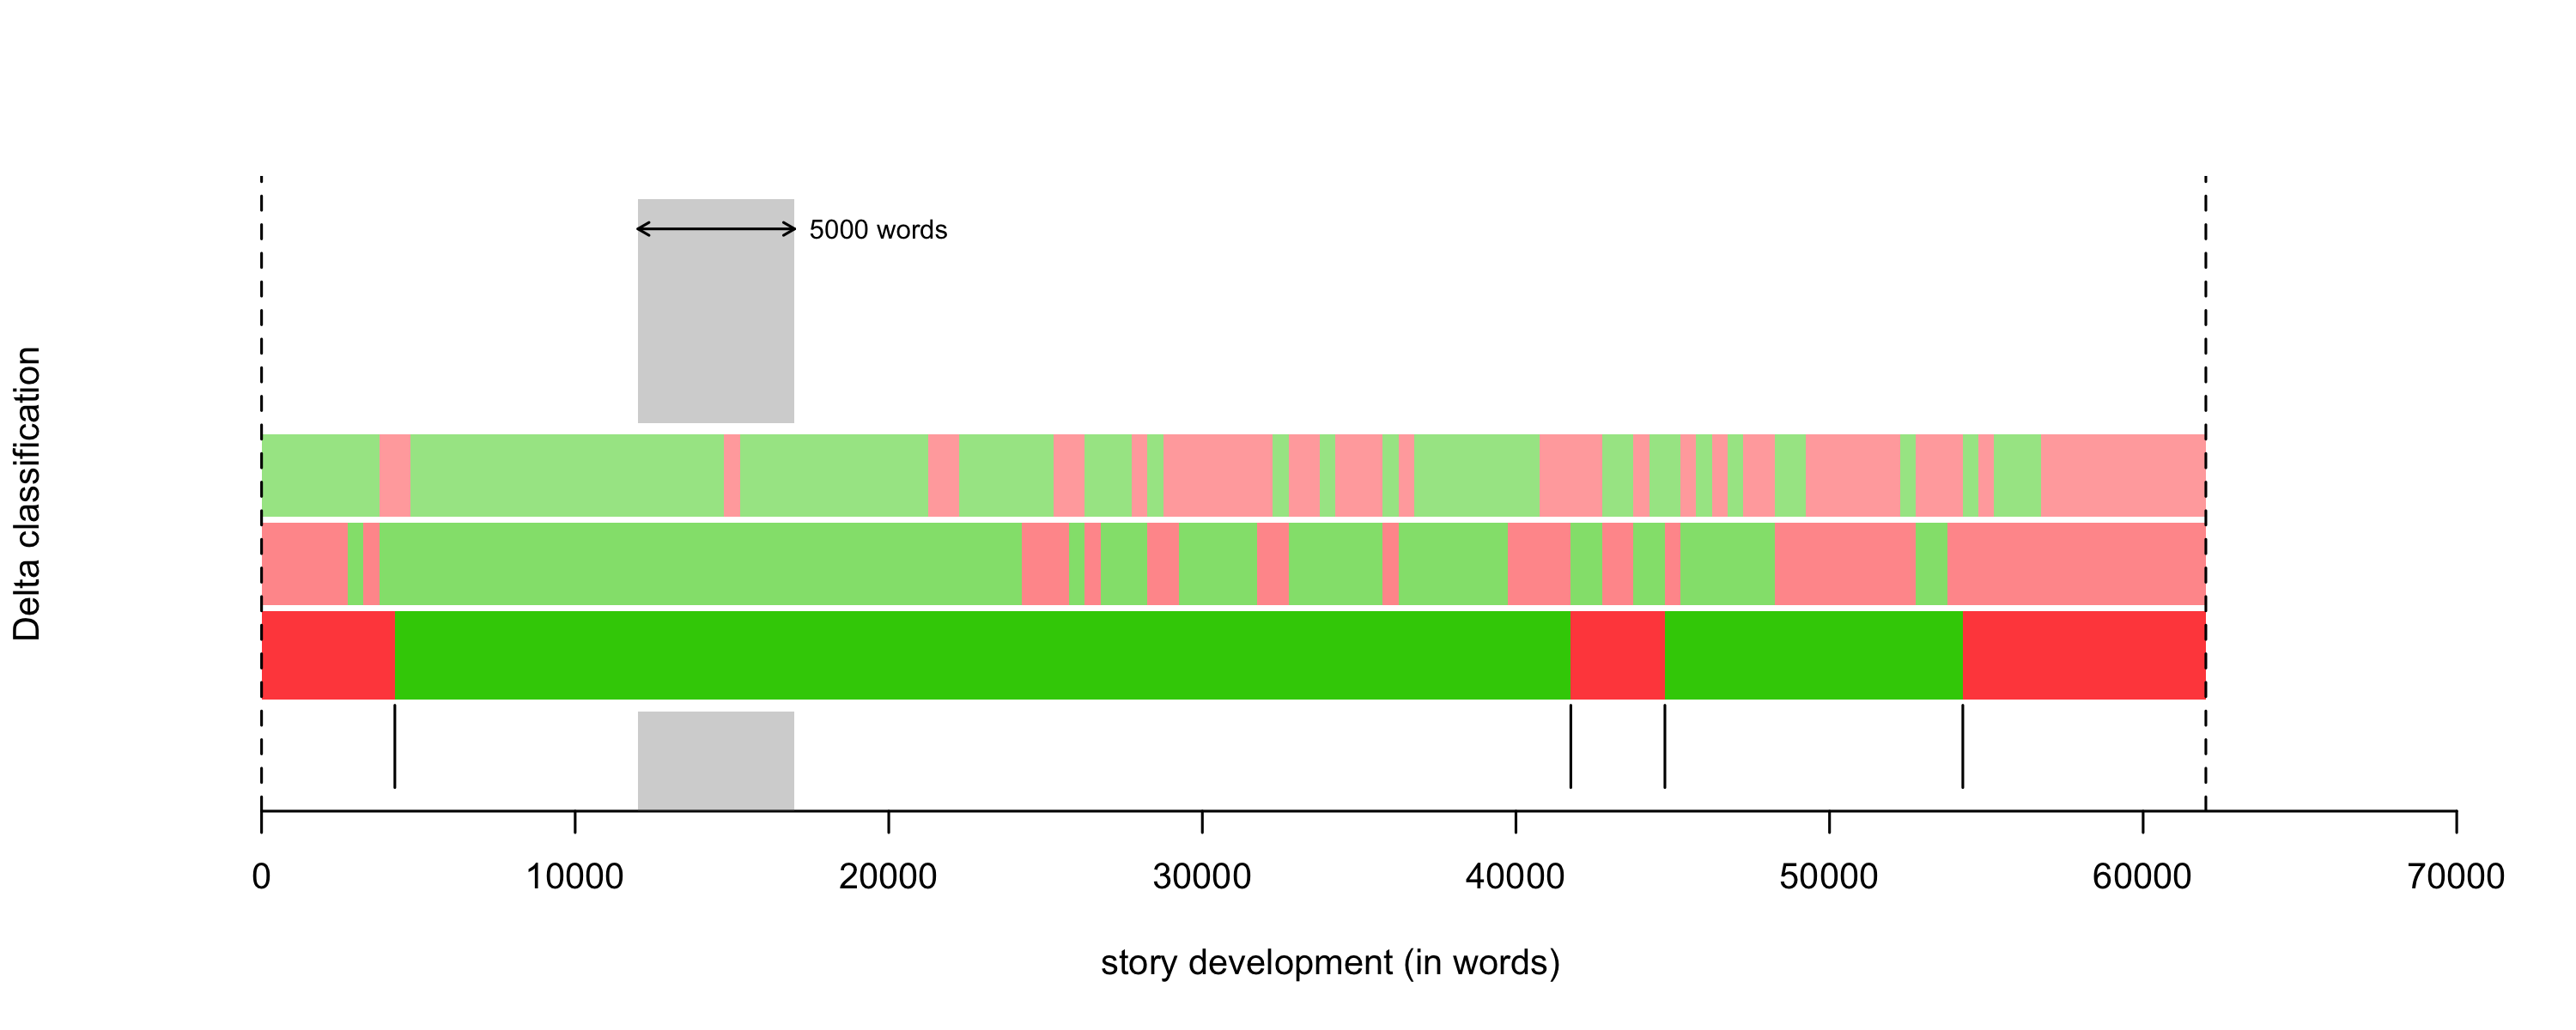
rolling.classify(write.png.file = TRUE, classification.method = "delta", mfw=500)
References
Eder, M. (2016). Rolling stylometry. Digital Scholarship in the Humanities, 31(3): 457-469, [pre-print].