Go Set A Watchman while we Kill the Mockingbird In Cold Blood
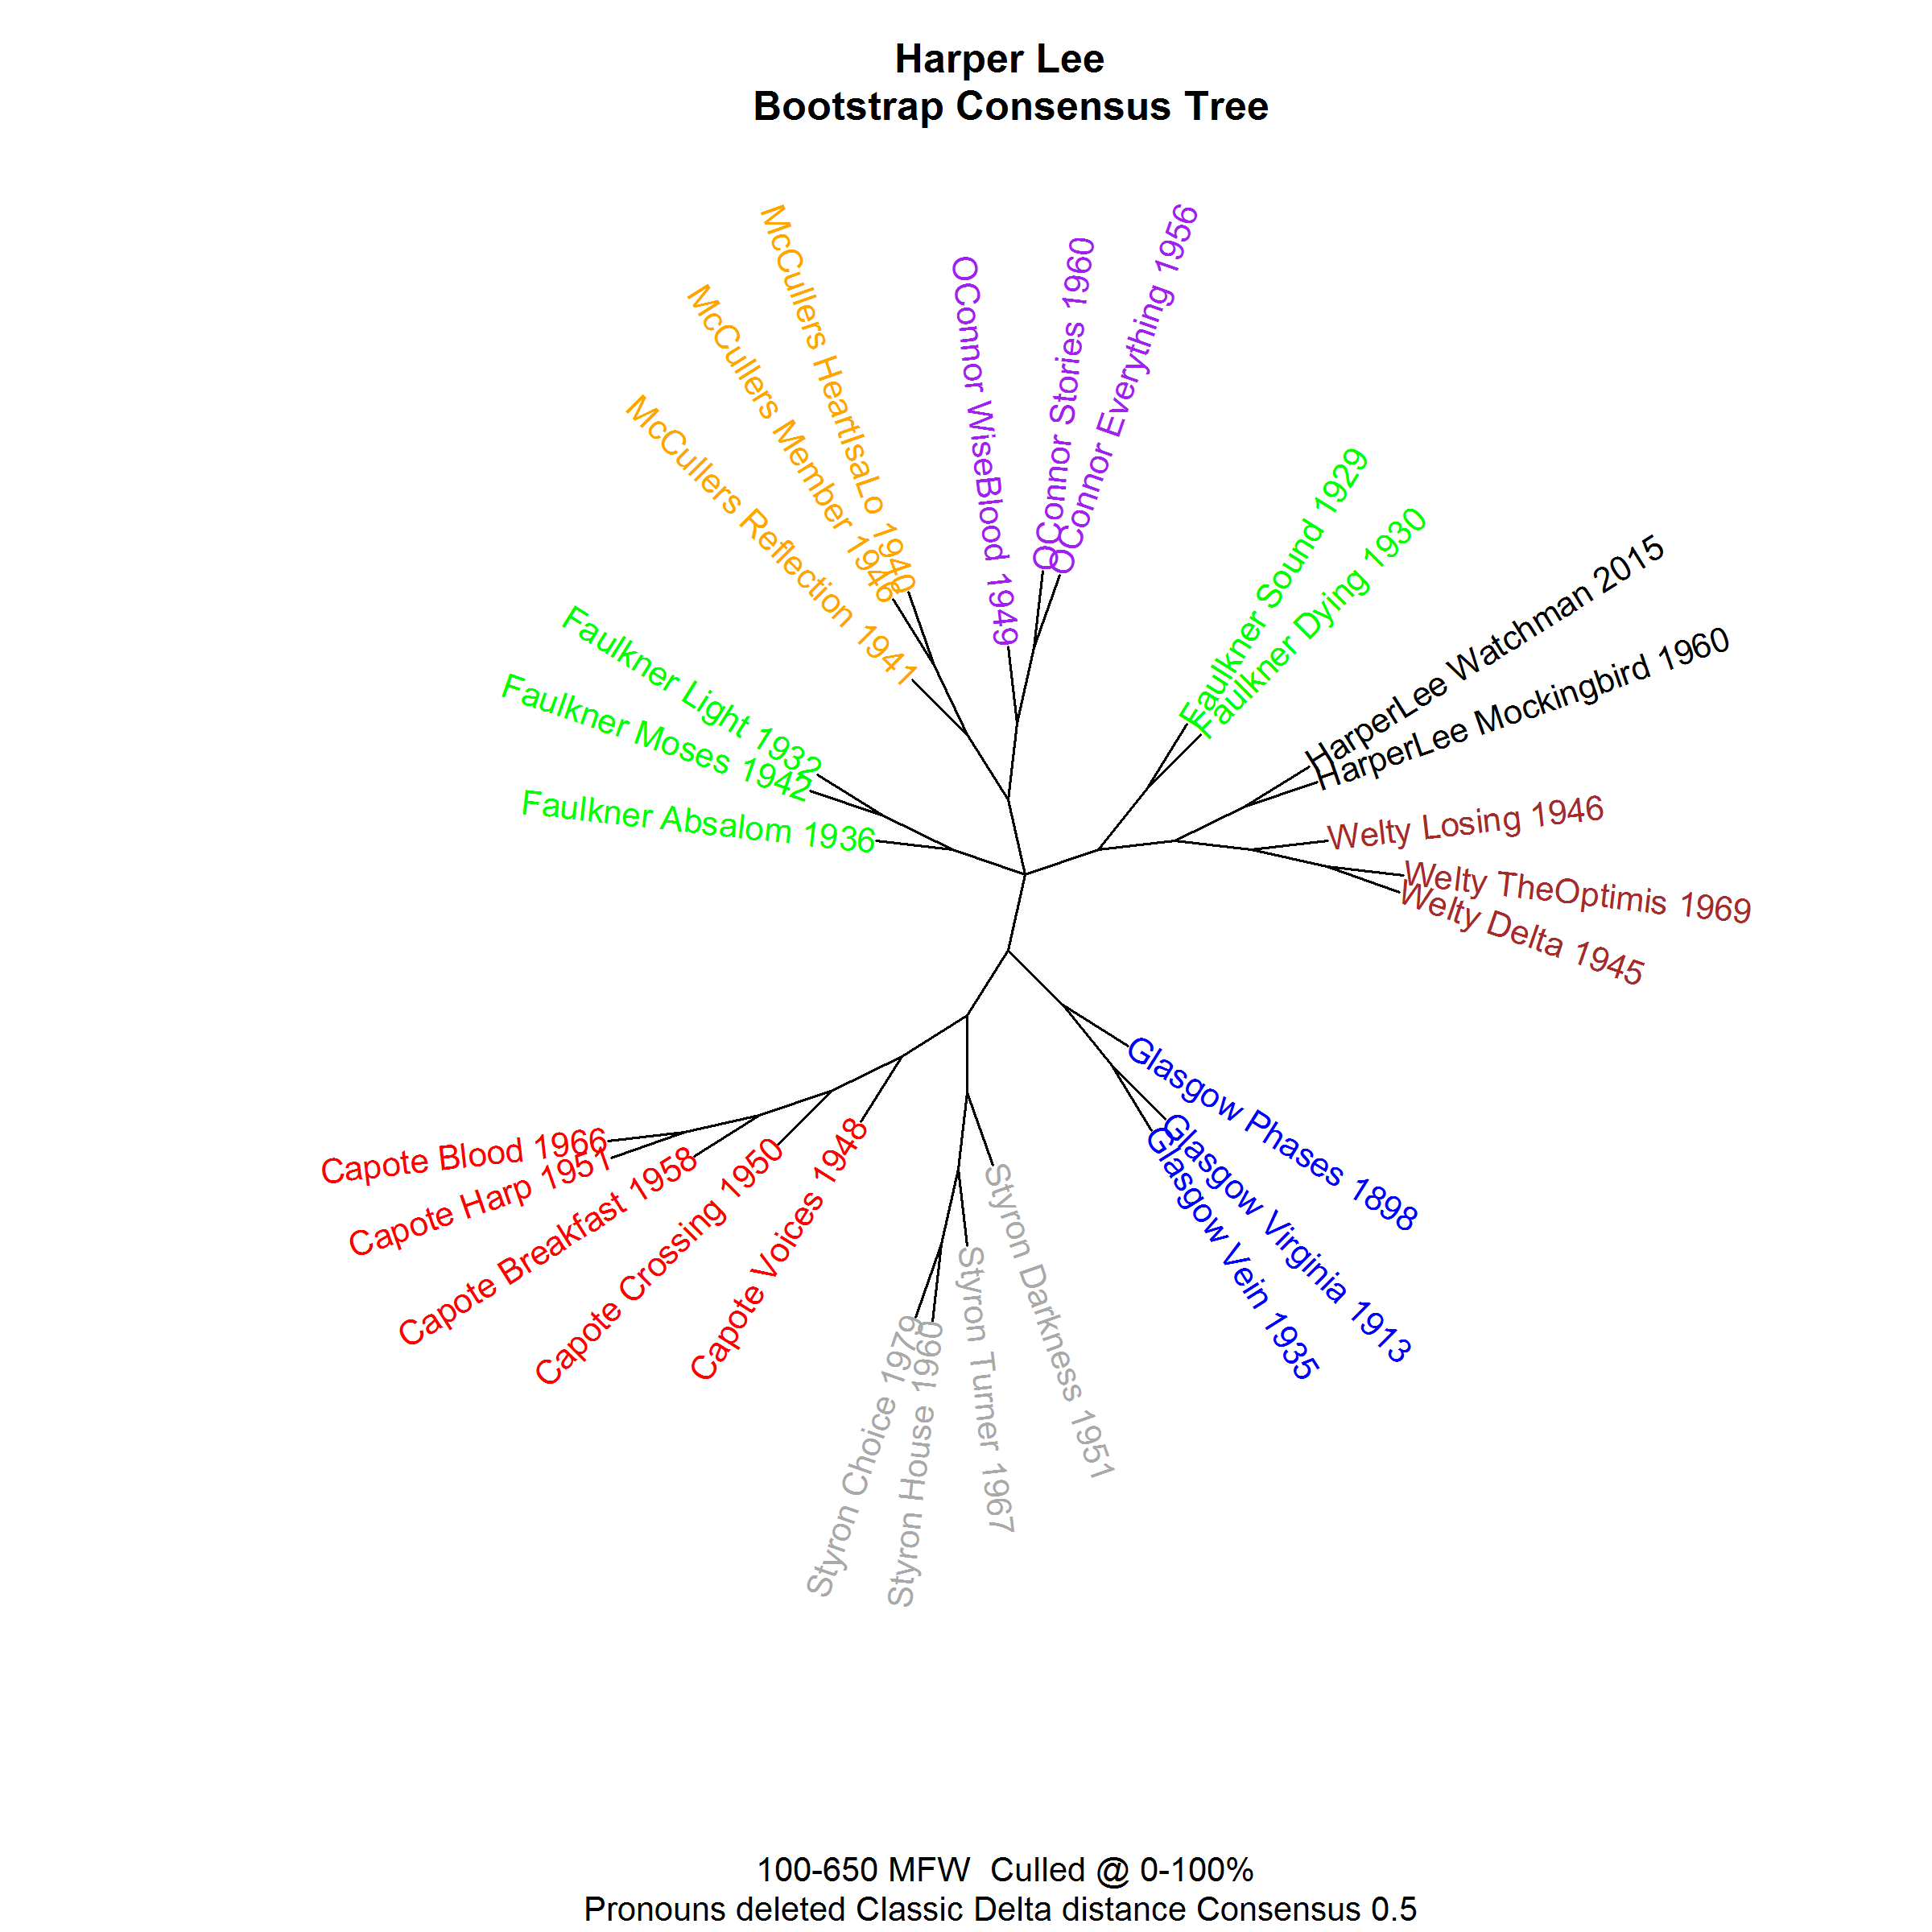
Stylometric evidence is very strong in this case: Harper Lee is the author of both To Kill A Mockingbird and Go Set A Watchman. The bootstrap consensus tree in Fig. 1 – where the consensus is that between numerous cluster analyses of most-frequent-word usage – shows her two books as two nearest neighbors just as it does to the other authors included for comparison here. It might be added that she is surrounded, in this graph, by two of her favorite authors, Faulkner and Welty. More importantly, perhaps, Truman Capote is far away. Since this sort of diagram is oriented at deciphering the strongest signal in word usage, authorship, the various rumors should be quenched – but will they?
But the study of literature and authorship is not only who wrote what, and who didn’t: it can be also about similarities and differences between texts by different authors. While some information about that can be gathered from the above graph, the one in Figure 2 makes sure other signals than just the strongest one are visible. This is a network analysis of the same data treated with the same statistical methods. The degree of similarity is shown by the thickness of the curves that connect the particular texts: the thicker the line, the stronger the similarity. Additionally, the texts are spatially distributed to provide an additional visualization effect. Imagine the colored curves here as rubber bands connected to each other: some of them are thick, some of them are thin. Now imagine that we start pulling at all those bands at the same time. The thick ones won’t allow themselves to be pulled apart too far (unless their strength is balanced by many of the smaller similarities); but the thin rubber bands will be extended much more. Obviously, there is some pretty complex math involved in all this pulling.
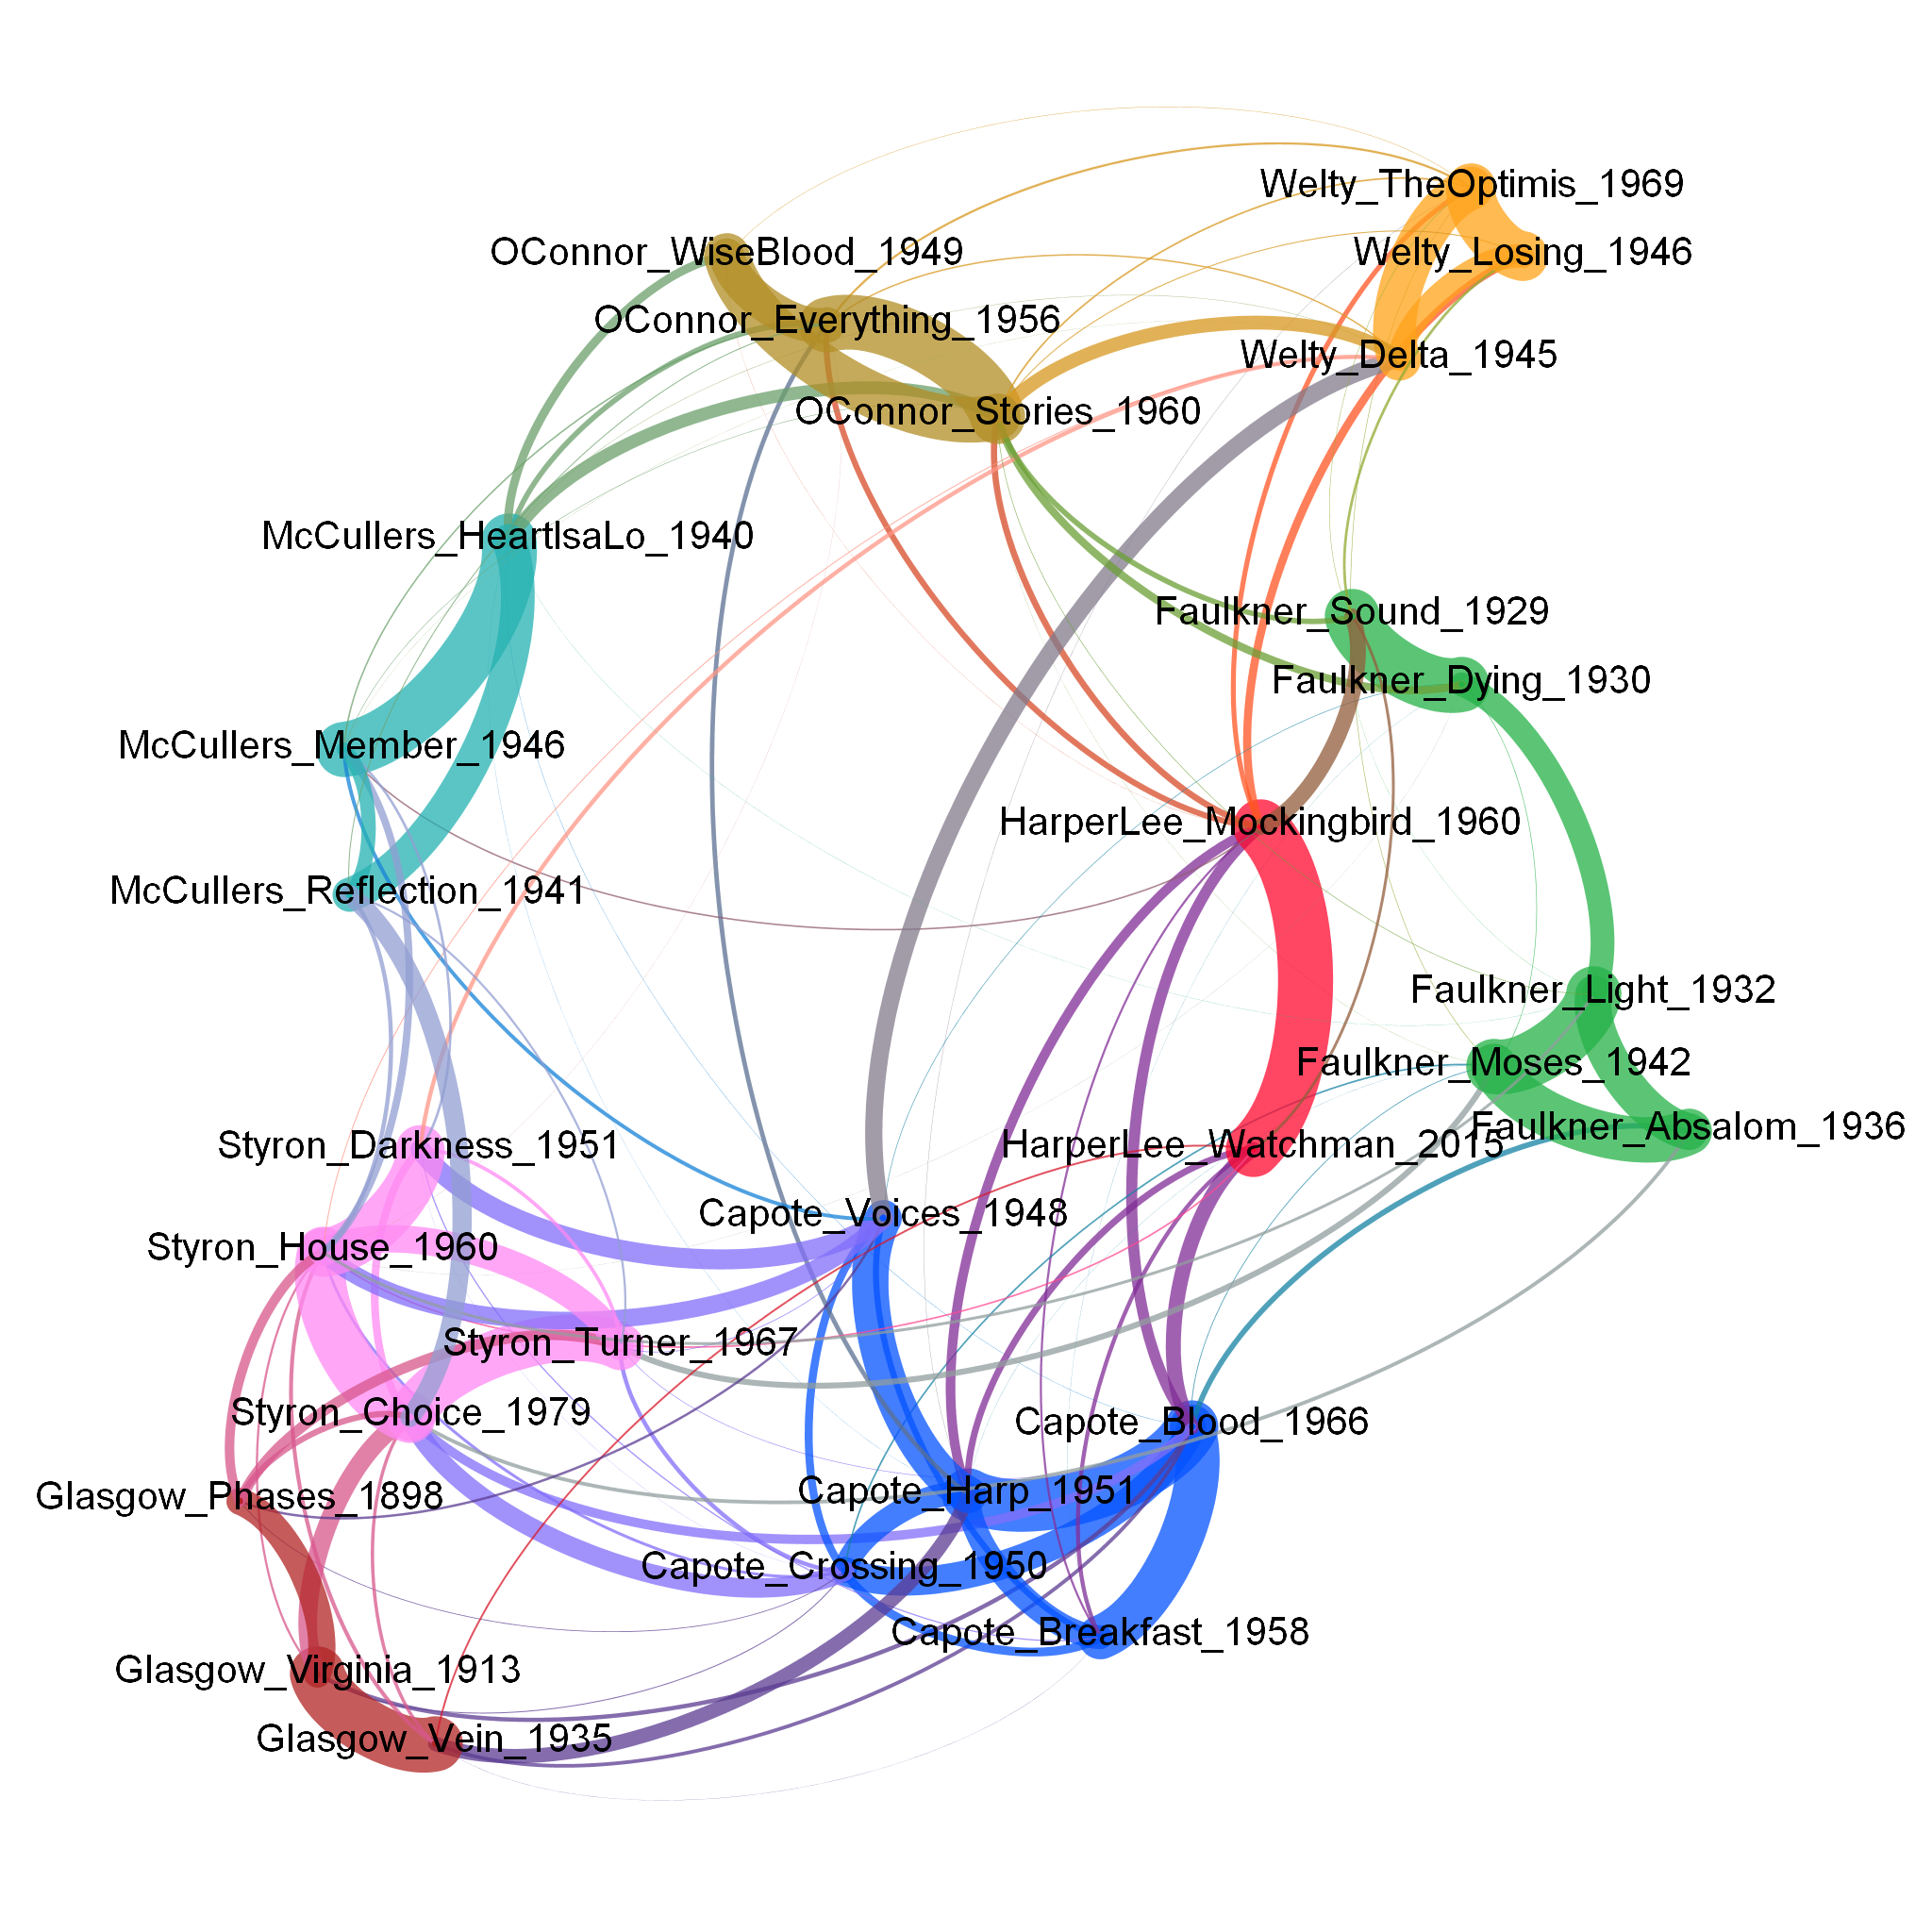
It is no surprise that this diagram echoes the previous one as far as the strongest similarities are concerned. Lee is Lee, and even Faulkner – who was split into two Faulkners in Fig. 1 – is now one in two persons. But now, the lesser forces – represented by the slightly narrower curves – also count. The first thing that strikes the eye in the Lee neighborhood is the Watchman’s affinity to In Cold Blood and a more heterogeneous pattern for the Mockingbird: the book researched by Capote with Lee is there too, but so is The Sound and the Fury. Does not Harold Bloom say Lee’s bestseller “comes out of an Alabama near related to William Faulkner’s Mississippi but in a cosmos apart from the world of Light in August, As I Lay Dying, The Sound and the Fury”? In this diagram, all three are very close (although only Sound is connected directly); indeed, Alabama is next door from Mississippi. So while this may show that either stylometric methods are wrong and Harold Bloom is right (or vice versa), or that the quantitative and qualitative methods, too, operate on different planes. To once again mingle the two, some visible similarity is also there between Lee and O’Connor, despite the latter’s famous dismissal of the Mockingbird: “When I was fifteen I would have loved it”.
This brings us to the Lee/Capote question, which is probably best answered by another method. We have already seen that they are (stylistically) very close to each other. Are they similar because they read the same books, or is there some degree of actual literary collaboration involved? Traces of mutual inspiration, copy-editing, and other ways of collaborative authorship have already been suggested. Since it is difficult to see overlapping stylometric signals in an entire novel, one can see much more when the novel is split into smaller fragments. The idea is simple. First, imagine a centipede. To inspect it using a microscope, we need to slice it into segments (it was already dead when we found it, of course). This allows us to see what’s inside the particular segments. Now, we go back to texts. The goal is to slice a given text – in our case, the Mockingbird – into equal-sized blocks and to apply the usual stylometric procedure to particular slices.
In Figs. 3–4, the Mockingbird is contrasted against the Watchman and The Grass Harp, representing Lee’s and Capote’s authorial voices, respectively. Each segment of the Mockingbird is now checked for stylometric similarity to one of these novels. The two diagrams represent two different ranges of frequent words analyzed. As it turns out, the claims about Capote’s alleged contribution to the Mockingbird are (mostly) unfounded, since a vast majority of segments are clearly classified to Lee (they are marked green).
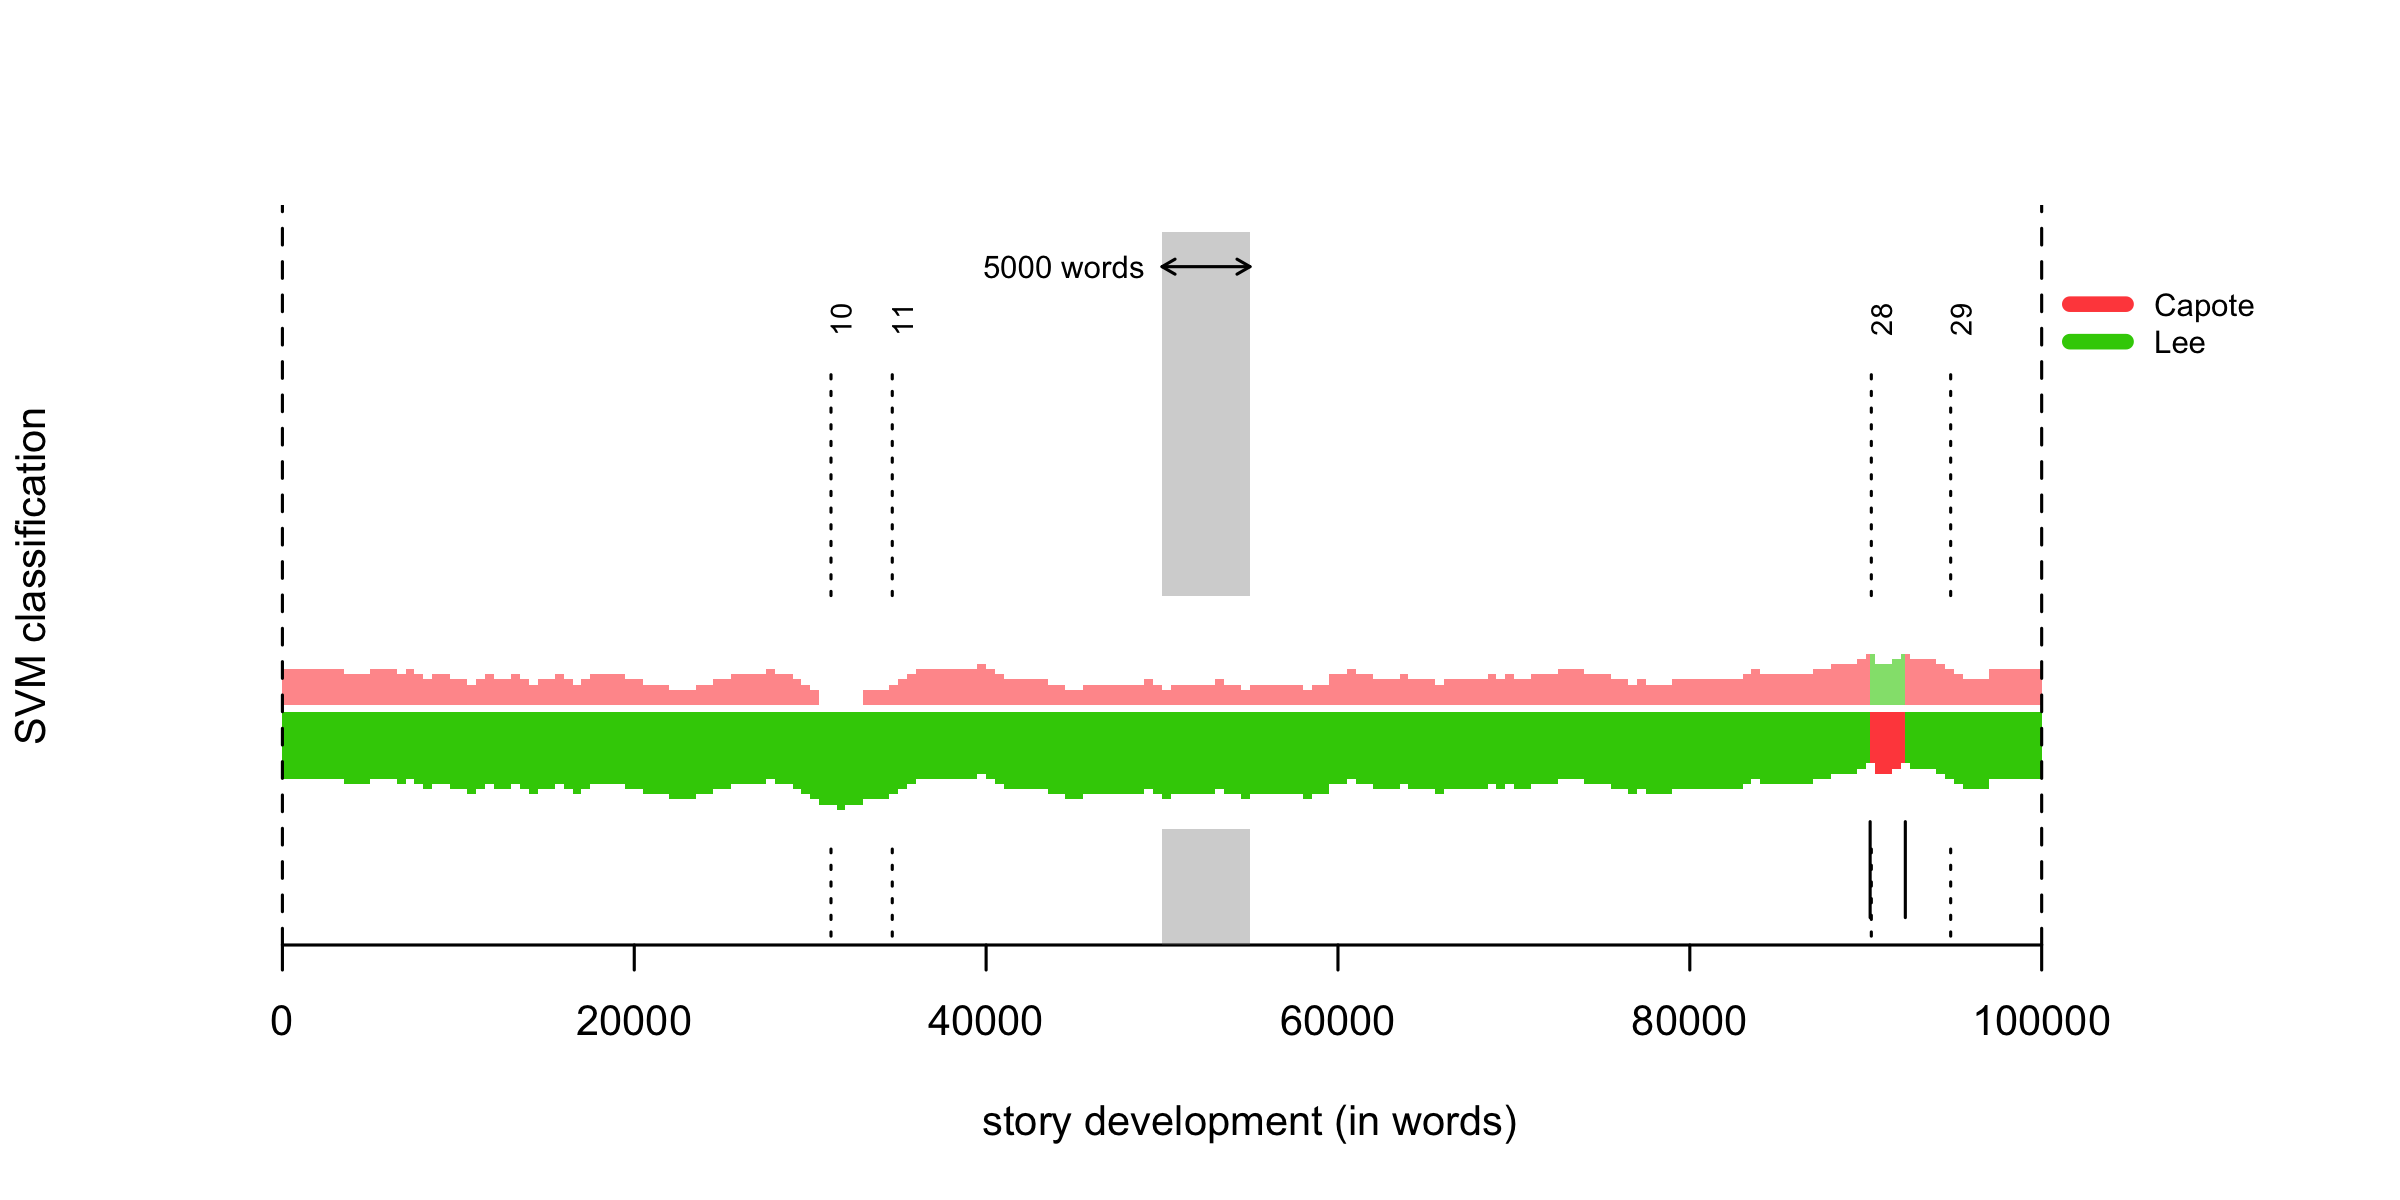
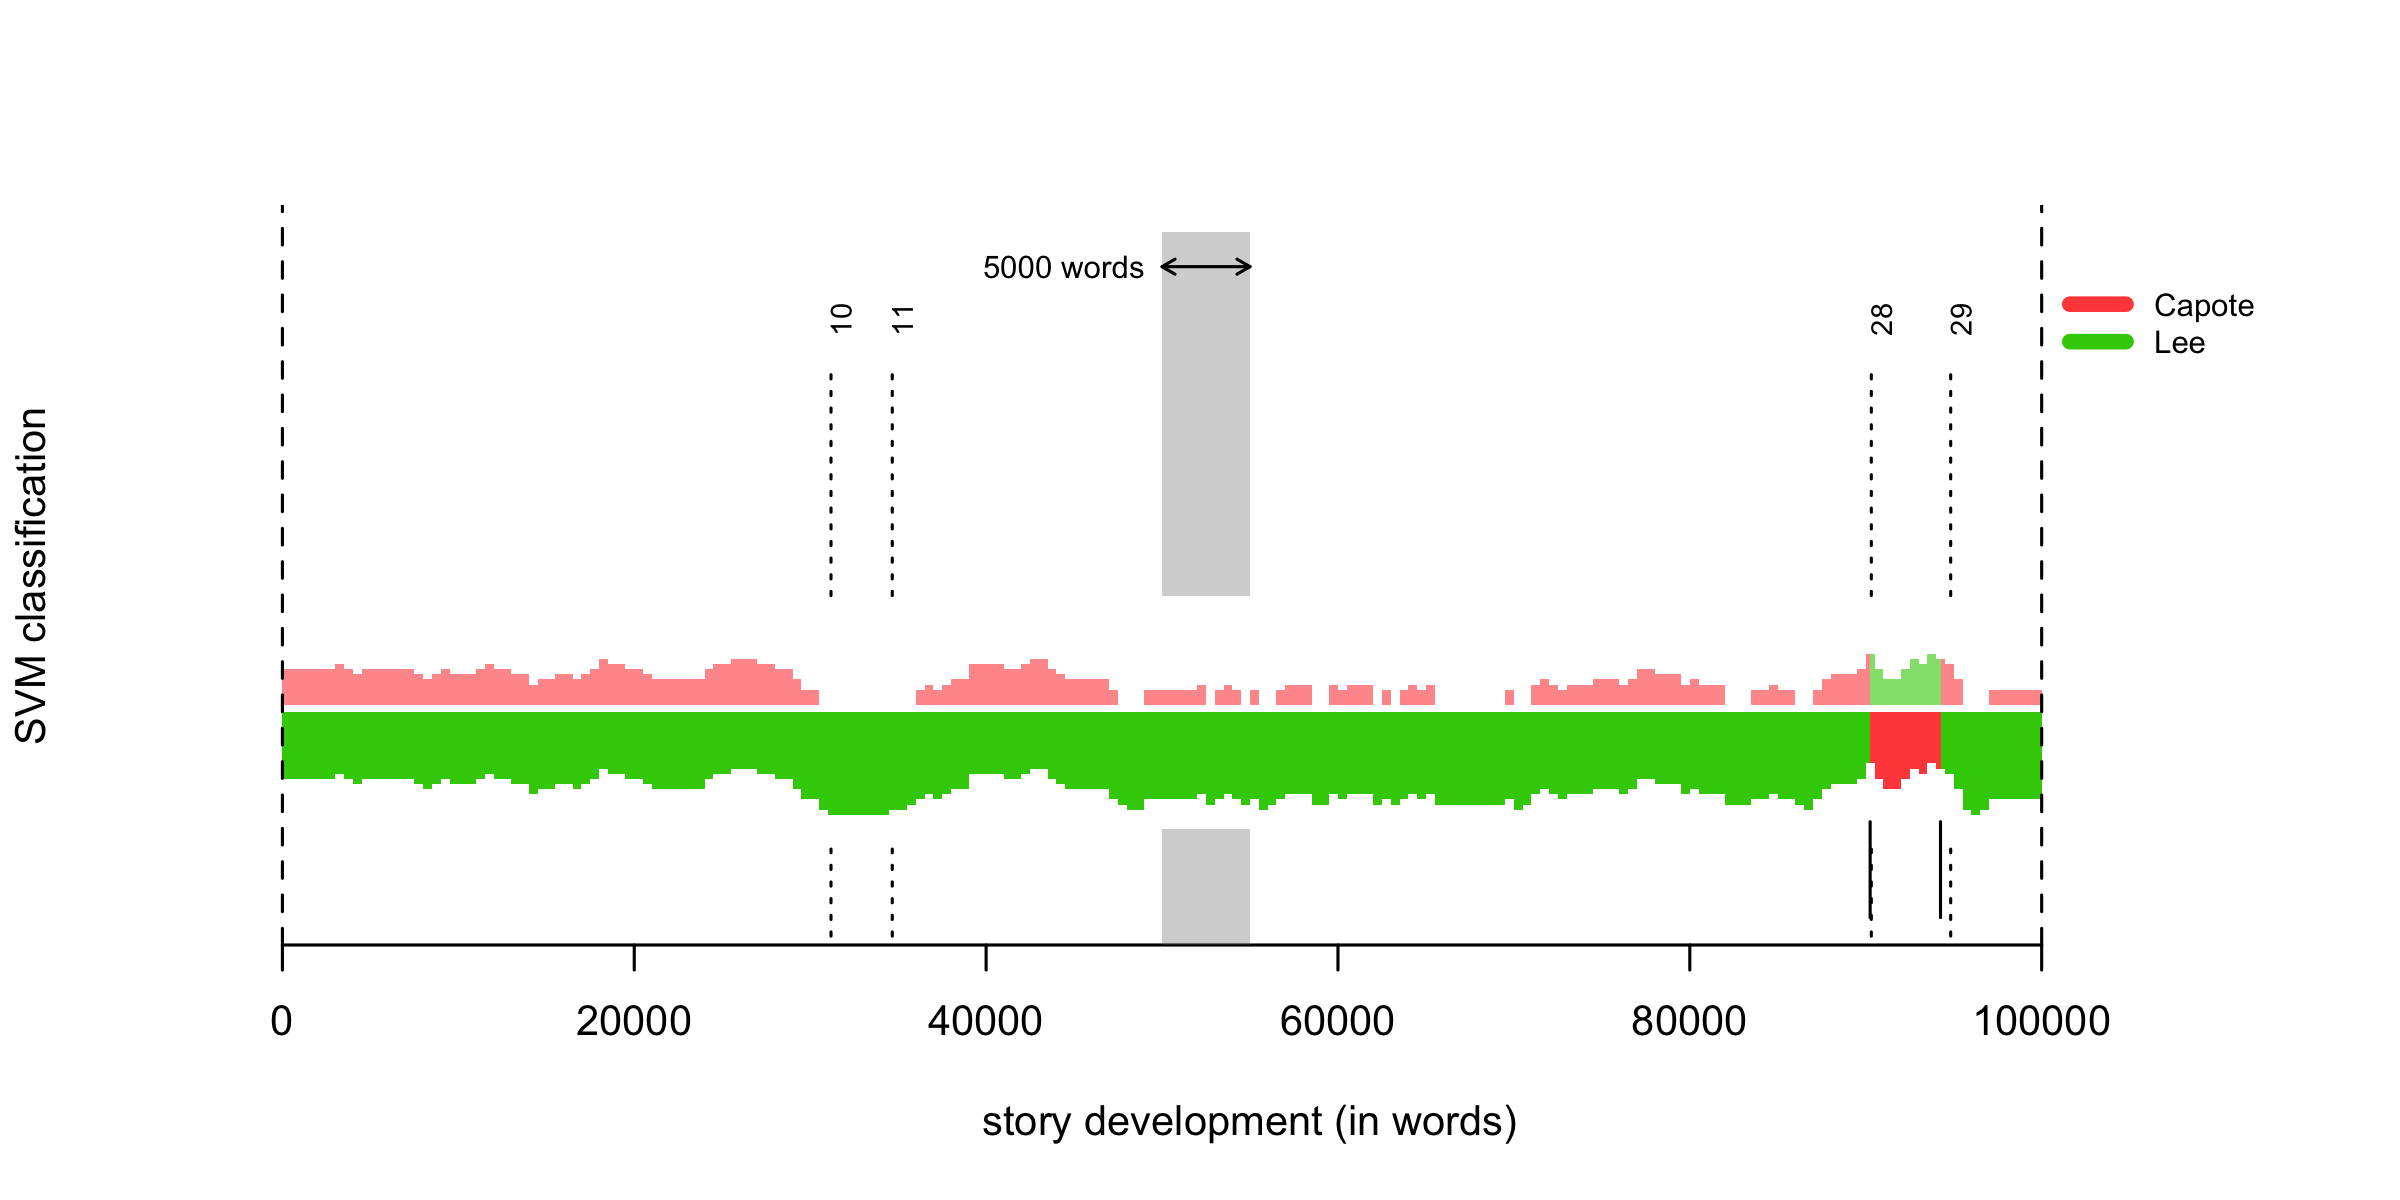
A vast majority of the segments, but not all of them! No matter which parameters are used, at the end of the novel there appear a number of red segments which clearly suggest that in this passage, Lee is more similar to Capote than to herself. Even more interesting is the fact that the passage in question exactly coincides with Chapter 28, which is… the climax of the novel: Scout, dressed up in a Halloween costume, is attacked by Bob Ewell; quite luckily for Scout, she survives and accidentally Ewell dies with a kitchen knife stuck under his ribs.
Certainly, this is not to suggest that Capote wrote the chapter in question. More probably, we are dealing here with a mixture of different stylometric signals, including extensive copy-editing and/or inspiration.
On the other hand, Lee is truest to herself in another crucial passage of the novel, namely Chapter 10, in which she introduces Atticus: apparently inept, he mystifies everyone when he proves himself to be the best shot in the county. This is visible in Figs. 3–4 in the single segment where Lee’s green is for once not accompanied by Capote’s red. The same phenomena can be observed when one compares the Mockingbird against Capote’s voice represented by In Cold Blood.
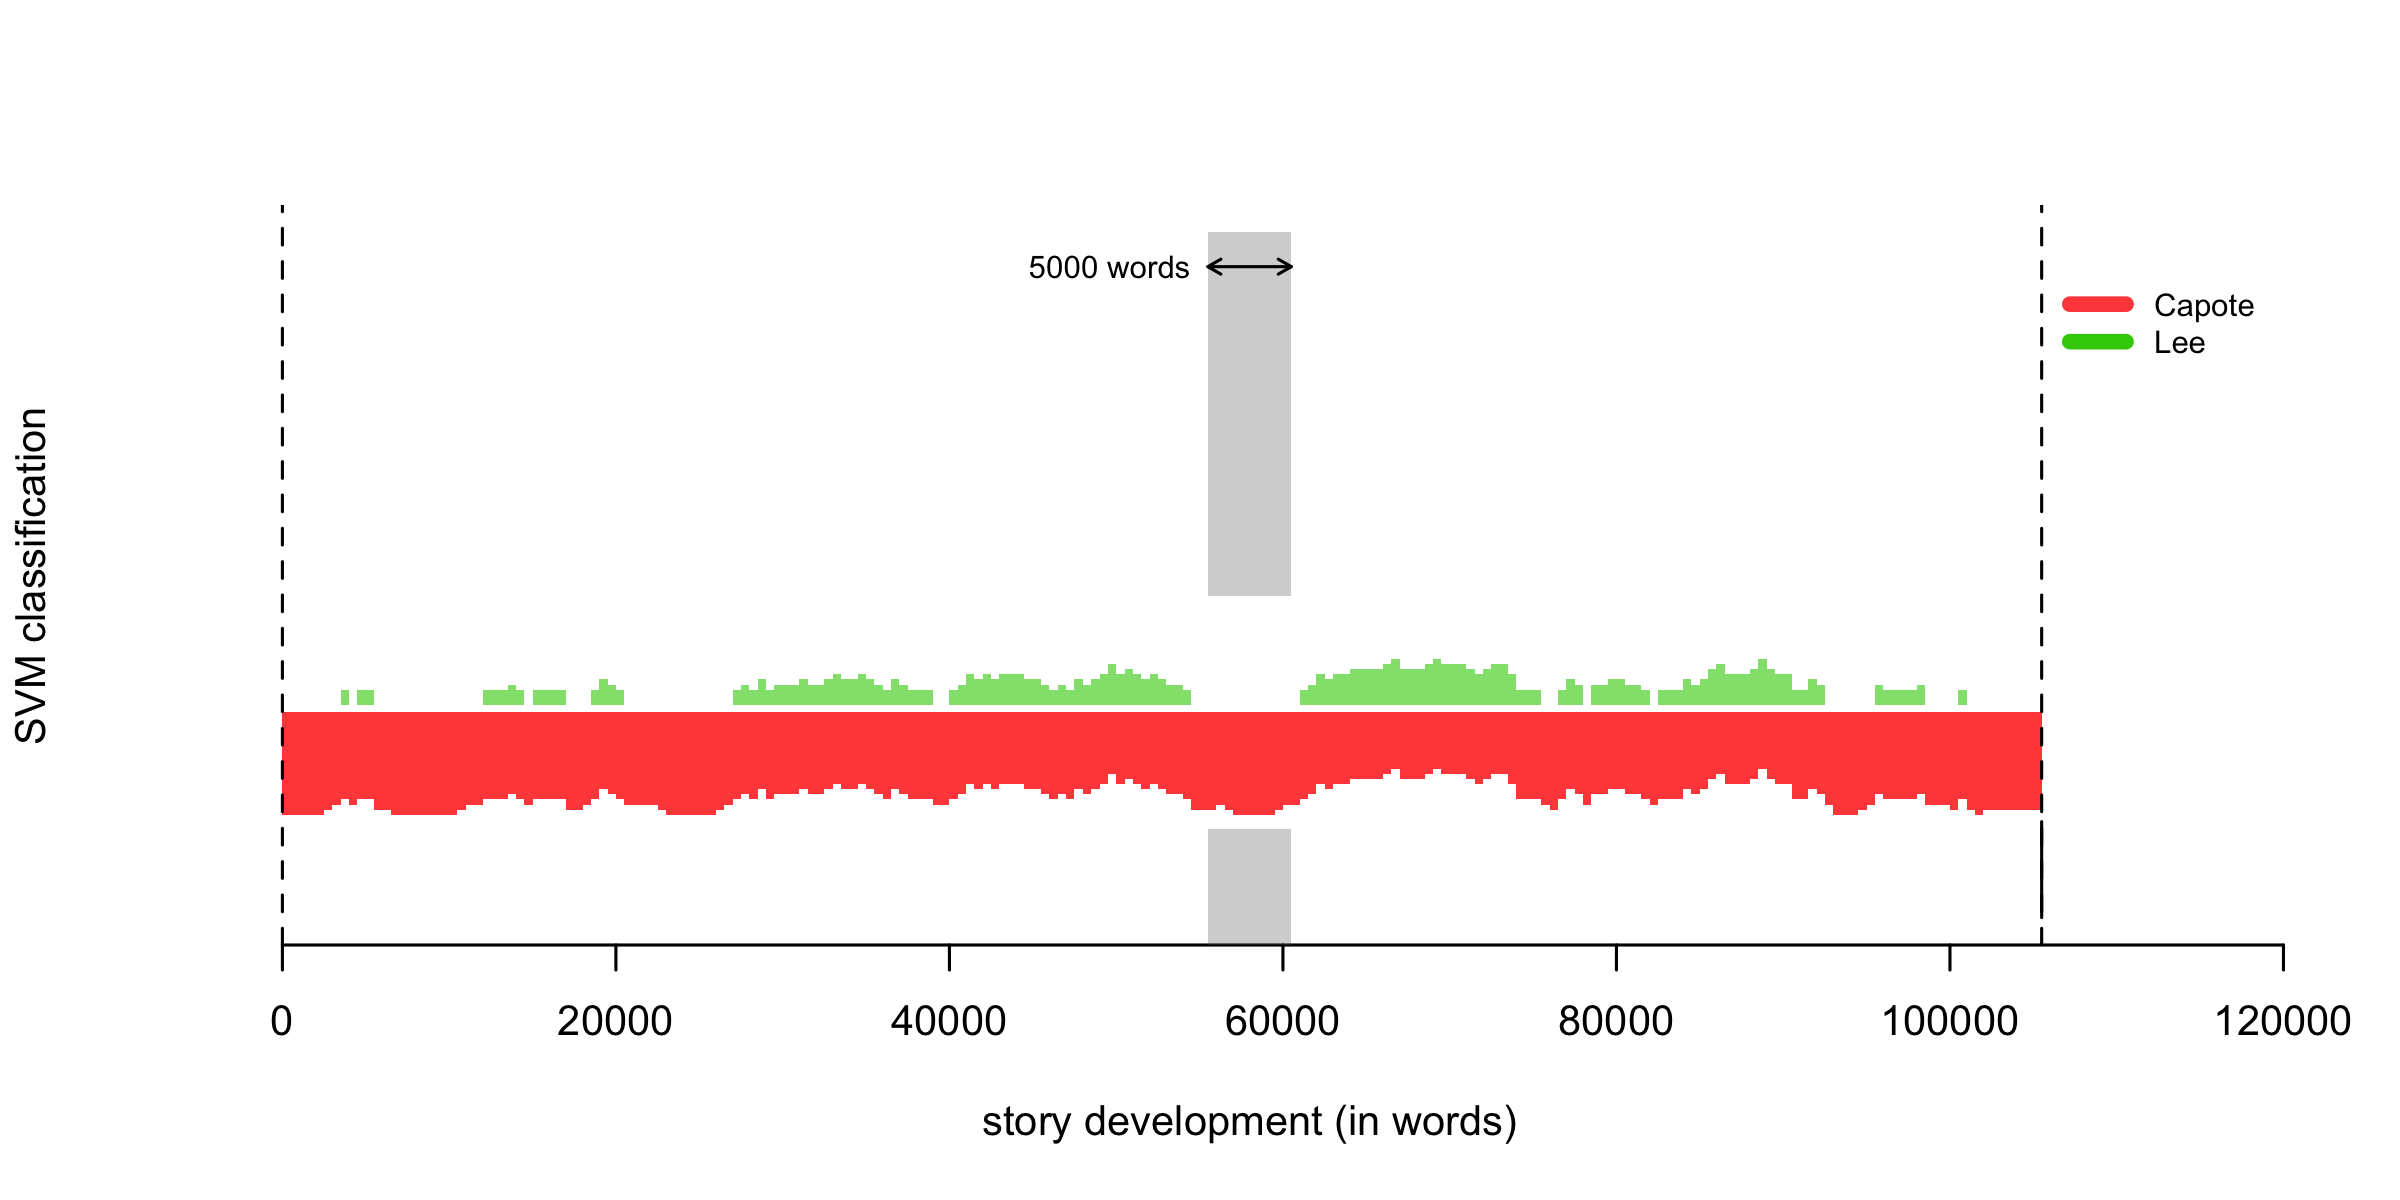
The elephant in the room: perhaps contrarily to expectations, there is much less ambiguity as to the authorship of In Cold Blood. Fig. 5 shows quite clearly whose the dominating voice is. We know that Harper Lee helped Capote; but stylometrically, her part is overwhelmed by the author on the title page. And her voice, only visible in the pale green strip in Fig. 5, is but the whisper of wind voices in the wind-bent wheat.